
Concept explainers
Videos
(a)
To find: The histogram for the given data set and then describe the shape of the distribution.
(a)
Answer to Problem 10SGR
Thegraph is shown in Figure 5 and the data is positively is skewed.
Explanation of Solution
Given:
The data set for the Iditarod winning times are,
Calculation:
Press STAT and press 1 to select edit for entering the data as shown in Figure 1
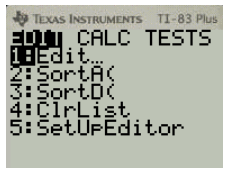
Figure 1
Enter all the values in the L1 one by on as shown in Figure 2
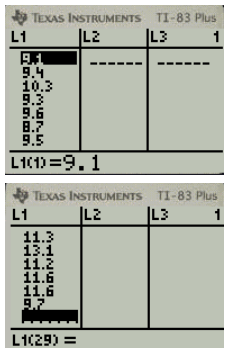
Figure 2
Press 2nd and Y= to select the stat plot as shown in Figure 3
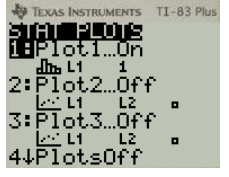
Figure 3
Select the plot number 1 and select the histogram plot as shown in Figure 4
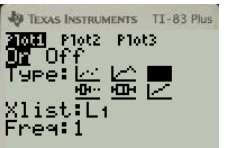
Figure 4
Press the Graph to obtain the plot as shown in Figure 5
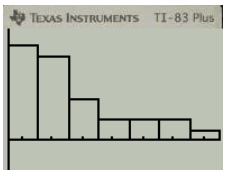
Figure 5
The histogram plot shows that the right of the median are distributed over the wider range than the data to the left. Thus, the data is positively skewed.
(b)
To find: The centre and the spread of the data using either the mean and standard deviation of the five number summary.
(b)
Answer to Problem 10SGR
Thewinning time of the race is the range from 8.7 to 18.1 the median timing is 11.55 and half of the winning time lies in the interval 9.55 to 11.55.
Explanation of Solution
As the distribution is skewed so use the five number summaries to understand the behaviour of the data.
Calculate the five point summary press the stat and select CALC as shown in Figure 6
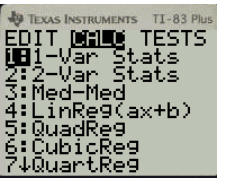
Figure 6
Press the enter button to calculate the statistical value as shown in Figure 7
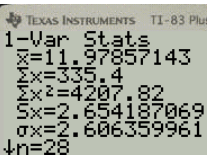
Figure 7
Scroll down to obtain the five point summary as shown in Figure 8

Figure 8
Thus, the winning time of the race is the range from 8.7 to 18.1 the median timing is 11.55 and half of the winning time lies in the interval 9.55 to 11.55,
Chapter 11 Solutions
Glencoe Algebra 2 Student Edition C2014
Additional Math Textbook Solutions
University Calculus: Early Transcendentals (4th Edition)
A Problem Solving Approach To Mathematics For Elementary School Teachers (13th Edition)
Introductory Statistics
Calculus: Early Transcendentals (2nd Edition)
Intro Stats, Books a la Carte Edition (5th Edition)


- A research study in the year 2009 found that there were 2760 coyotes in a given region. The coyote population declined at a rate of 5.8% each year. How many fewer coyotes were there in 2024 than in 2015? Explain in at least one sentence how you solved the problem. Show your work. Round your answer to the nearest whole number.arrow_forwardAnswer the following questions related to the following matrix A = 3 ³).arrow_forwardExplain the following termsarrow_forward
- Solve questions by Course Name (Ordinary Differential Equations II 2)arrow_forwardplease Solve questions by Course Name( Ordinary Differential Equations II 2)arrow_forwardInThe Northern Lights are bright flashes of colored light between 50 and 200 miles above Earth. Suppose a flash occurs 150 miles above Earth. What is the measure of arc BD, the portion of Earth from which the flash is visible? (Earth’s radius is approximately 4000 miles.)arrow_forward
- e). n! (n - 1)!arrow_forwardSuppose you flip a fair two-sided coin four times and record the result. a). List the sample space of this experiment. That is, list all possible outcomes that could occur when flipping a fair two-sided coin four total times. Assume the two sides of the coin are Heads (H) and Tails (T).arrow_forwarde). n! (n - 1)!arrow_forward
 Algebra and Trigonometry (6th Edition)AlgebraISBN:9780134463216Author:Robert F. BlitzerPublisher:PEARSON
 Contemporary Abstract AlgebraAlgebraISBN:9781305657960Author:Joseph GallianPublisher:Cengage Learning
 Linear Algebra: A Modern IntroductionAlgebraISBN:9781285463247Author:David PoolePublisher:Cengage Learning
 Algebra And Trigonometry (11th Edition)AlgebraISBN:9780135163078Author:Michael SullivanPublisher:PEARSON
 Introduction to Linear Algebra, Fifth EditionAlgebraISBN:9780980232776Author:Gilbert StrangPublisher:Wellesley-Cambridge Press
 College Algebra (Collegiate Math)AlgebraISBN:9780077836344Author:Julie Miller, Donna GerkenPublisher:McGraw-Hill Education