
Concept explainers
Videos
a.
To simulate the experiment for product A and use the random number generator on a graphing calculator.
a.
Explanation of Solution
Given:
The product A is
Calculation:
Let us first simulate the experiment for product A. Use the random number generator on a graphing calculator to generate 30 integers between 0 and 9. Let 0-6 represent an effective outcome and 7-9 represent an ineffective outcome. Use TI-83 Calculator for random number generator. The procedure is given as below;
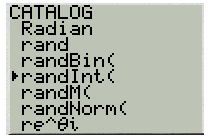
1. Switch ON the calculator and bring up the CATALOG by pressing 2nd followed by the digit 0. Select the randInt( function as shown below by pressing ENTER.
2. Complete the function by as shown below to generate a random number between 0 and 9.
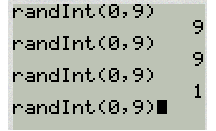
Repeat 30 times to get 30 integers between 0 and 9. A sample list of generated integers is given as 0, 9, 0, 4, 6, 2, 2, 3, 1, 3, 5, 0, 8, 0, 7, 8, 6, 2, 1, 1, 6, 0, 9, 2, 0, 7, 3, 1, 8, and 7. Thus, there are 22 effective outcomes and 8 ineffective outcomes.
Repeat the process to simulate an experiment for Product B. Use the random number generator on a graphing calculator ..., let 0-7 represent an effective outcome and 8-9 represent an ineffective outcome. A sample list of generated integers is 5, 9, 0, 0, 7, 8, 0, 1, 9, 2, 4, 3, 3, 5, 9, 1, 4, 4, 1, 5, 7, 0, 5, 9, 6, 2, 7, 3, 2, and 4. Thus, there are 25 effective outcomes and 5 ineffective outcomes.
b.
To find the probability of product A being effective and product B being effective.
b.
Answer to Problem 27PPS
Explanation of Solution
Given:
The product A is
Calculation:
The frequency tables for Product A and Product B are shown below.
Product A:
| Number | Frequency |
| 0-6 | 22 |
| 7-9 | 8 |
Product B
| Number | Frequency |
| 0-6 | 25 |
| 7-9 | 5 |
The probability that Product A was effective is:
Similarly, the probability that Product B was effective is:
c.
To compare the probabilities and to tell the difference in the effectiveness of one product over the other.
c.
Explanation of Solution
Given:
The product A is
Calculation:
Based on the obtained probabilities in the part (b), it is justifiable to select Product B over Product A as it has a higher number of effective outcomes and the difference of 10% in the probabilities is a significant one.
d.
To explain that the probability of the product’s effectiveness justifies the price difference.
d.
Explanation of Solution
Given:
The product A is
Calculation:
It depends on the actual product. For generic products, the 10% higher effectiveness of Product B might not be justifiable for twice the cost. But if Product B is a life-saving drug, the price difference might be justified because effectiveness of the medicine is more important than the price.
Chapter 11 Solutions
Glencoe Algebra 2 Student Edition C2014
Additional Math Textbook Solutions
Thinking Mathematically (6th Edition)
A Problem Solving Approach To Mathematics For Elementary School Teachers (13th Edition)
Pre-Algebra Student Edition
A First Course in Probability (10th Edition)
Elementary Statistics (13th Edition)
Calculus: Early Transcendentals (2nd Edition)


- The Course Name Real Analysis please Solve questions by Real Analysisarrow_forwardpart 3 of the question is: A power outage occurs 6 min after the ride started. Passengers must wait for their cage to be manually cranked into the lowest position in order to exit the ride. Sine function model: where h is the height of the last passenger above the ground measured in feet and t is the time of operation of the ride in minutes. What is the height of the last passenger at the moment of the power outage? Verify your answer by evaluating the sine function model. Will the last passenger to board the ride need to wait in order to exit the ride? Explain.arrow_forward2. The duration of the ride is 15 min. (a) How many times does the last passenger who boarded the ride make a complete loop on the Ferris wheel? (b) What is the position of that passenger when the ride ends?arrow_forward
- 3. A scientist recorded the movement of a pendulum for 10 s. The scientist began recording when the pendulum was at its resting position. The pendulum then moved right (positive displacement) and left (negative displacement) several times. The pendulum took 4 s to swing to the right and the left and then return to its resting position. The pendulum's furthest distance to either side was 6 in. Graph the function that represents the pendulum's displacement as a function of time. Answer: f(t) (a) Write an equation to represent the displacement of the pendulum as a function of time. (b) Graph the function. 10 9 8 7 6 5 4 3 2 1 0 t 1 2 3 4 5 6 7 8 9 10 11 12 13 14 15 -1 -5. -6 -7 -8 -9 -10-arrow_forwardA power outage occurs 6 min after the ride started. Passengers must wait for their cage to be manually cranked into the lowest position in order to exit the ride. Sine function model: h = −82.5 cos (3πt) + 97.5 where h is the height of the last passenger above the ground measured in feet and t is the time of operation of the ride in minutes. (a) What is the height of the last passenger at the moment of the power outage? Verify your answer by evaluating the sine function model. (b) Will the last passenger to board the ride need to wait in order to exit the ride? Explain.arrow_forwardThe Colossus Ferris wheel debuted at the 1984 New Orleans World's Fair. The ride is 180 ft tall, and passengers board the ride at an initial height of 15 ft above the ground. The height above ground, h, of a passenger on the ride is a periodic function of time, t. The graph displays the height above ground of the last passenger to board over the course of the 15 min ride. Height of Passenger in Ferris Wheel 180 160 140- €120 Height, h (ft) 100 80 60 40 20 0 ך 1 2 3 4 5 6 7 8 9 10 11 12 13 14 15 Time of operation, t (min) Sine function model: h = −82.5 cos (3πt) + 97.5 where h is the height of the passenger above the ground measured in feet and t is the time of operation of the ride in minutes. What is the period of the sine function model? Interpret the period you found in the context of the operation of the Ferris wheel. Answer:arrow_forward
- 1. Graph the function f(x)=sin(x) −2¸ Answer: y -2π 一元 1 −1 -2 -3 -4+ 元 2πarrow_forward3. Graph the function f(x) = −(x-2)²+4 Answer: f(x) 6 5 4 3 2+ 1 -6-5 -4-3-2-1 × 1 2 3 4 5 6 -1 -2+ ရာ -3+ -4+ -5 -6arrow_forward2. Graph the function f(x) = cos(2x)+1 Answer: -2π 一元 y 3 2- 1 -1 -2+ ရာ -3- Π 2πarrow_forward
- 2. Graph the function f(x) = |x+1+2 Answer: -6-5-4-3-2-1 f(x) 6 5 4 3 2 1 1 2 3 4 5 6 -1 -2 -3 -4 -5 -6arrow_forward1. The table shows values of a function f(x). What is the average rate of change of f(x) over the interval from x = 5 to x = 9? Show your work. X 4 f(x) LO 5 6 7 8 9 10 -2 8 10 11 14 18arrow_forward• Find a real-world situation that can be represented by a sinusoidal function. You may find something online that represents a sinusoidal graph or you can create a sinusoidal graph yourself with a measuring tape and a rope. • Provide a graph complete with labels and units for the x- and y-axes. • Describe the amplitude, period, and vertical shift in terms of the real-world situation.arrow_forward
 Algebra and Trigonometry (6th Edition)AlgebraISBN:9780134463216Author:Robert F. BlitzerPublisher:PEARSON
 Contemporary Abstract AlgebraAlgebraISBN:9781305657960Author:Joseph GallianPublisher:Cengage Learning
 Linear Algebra: A Modern IntroductionAlgebraISBN:9781285463247Author:David PoolePublisher:Cengage Learning
 Algebra And Trigonometry (11th Edition)AlgebraISBN:9780135163078Author:Michael SullivanPublisher:PEARSON
 Introduction to Linear Algebra, Fifth EditionAlgebraISBN:9780980232776Author:Gilbert StrangPublisher:Wellesley-Cambridge Press
 College Algebra (Collegiate Math)AlgebraISBN:9780077836344Author:Julie Miller, Donna GerkenPublisher:McGraw-Hill Education