
Videos
Fumonisins are environmental toxins produced by a type of mold and have been found in corn and in products made from raw corn. The Center for Food Safety and Applied Nutrition provided recommendations on allowable fumonisin levels in human food and in animal feed based on a study of corn meal. The study compared corn meal made from partially degermed corn (corn that has had the germ, the part of the kernel located at the bottom center of the kernel that is used to produce corn oil, partially removed) and corn meal made from corn that has not been degermed. Specimens of corn meal were analyzed and the total fumonisin level (ppm) was determined for each specimen. Summary statistics for total fumonisin level from the U.S. Food and Drug Administration’s web site are given here.
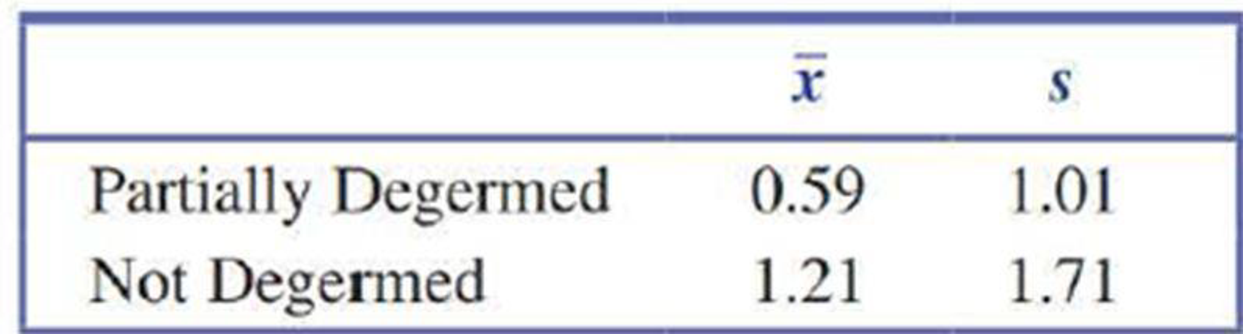
- a. If the given means and standard deviations had been based on a random sample of 10 partially degermed specimens and a random sample of 10 specimens made from com that was not degermed, explain why it would not be appropriate to carry out a two-sample t test to determine if there is a significant difference in the
mean fumonisin level for the two types of corn meal. - b. Suppose instead that each of the random samples had included 50 com meal specimens. Explain why it would now be reasonable to carry out a two-sample t test.
- c. Assuming that each random
sample size was 50, carry out a test to determine if there is a significant difference in mean fumonisin level for the two types of com meal. Use a significance level of 0.01.

Trending nowThis is a popular solution!

Chapter 11 Solutions
Introduction to Statistics and Data Analysis


- Cash flow and profits are both crucial aspects of a business. Profit is the surplus revenue after deducting business expenses. Cash flow is the total amount of cash moving in and out of your business. For a business to be successful in the long term, it needs to generate profits while also operating with positive cash flow. During the Covid-19 pandemic, however, of a random sample of 199 auditors, 104 indicated some measure of agreement with this statement: cash flow is more important to keep the business operating on a day-to-day basis. a) Investigate the claim that one-half of the members of this population would agree with this statement. Also, find and interpret the p-value of this test. b) Find the probability of accepting the claim with a 10%-level test if, in fact, 60% of all auditors agree that cash flow is an important indicator to keep the business operating on a day-to-day basis.arrow_forwardAnemia (low healthy blood cells or hemoglobin) has an important role in exercise performance. However, the direct link between rapid changes of hemoglobin and exercise performance is still unknown. A study investigated 18 patients with a blood disorder (beta-thalassemia). Participants in the study performed an exercise test before and the day after receiving a blood transfusion. Data are given in the table. HB = Hemoglobin RER = Respiratory exchange ID Change in HB Obese RER > 1.1 ratio No No 1 -1.4 No -1.5 No Yes No Yes 3 -2 No 4 -2.1 No -1.9 Yes Yes No -1.6 -1.8 -0.8 6 7 No Yes No Yes 8 9. -1 No No -1.2 No Yes 10 11 No No -0.8 -1.5 12 Yes No No Yes 13 14 -1.4 -2.6 -1.7 No No Yes Yes 15 Yes No Yes Yes 16 -2.6 No 17 18 -2.7 -1.5 Noarrow_forwardThe stated goal of a chain of service stores is to provide a lube and oil change for anyone's automobile in 15 minutes. The manager at one store thinks that there is a growing disparity among his workers in the time it takes to lube and change the oil of an automobile. To monitor this, the manager has selected a sample of 20 days and has recorded the time it took to service 100 automobiles each day. Data about the number of times the service was performed in 15 minutes or less (515) are found below. Complete parts a through c Click the icon to view the data. a. Compute p and sp p-(Round to four decimal places as needed.) Sp (Round to four decimal places as needed) b. Construct a p-chart and determine if the process of the time required for oil and lube jobs is in control Which graph below shows a p-chart for the data? O A. OB. Am 0.05 -ww Is the process in control? OA. Since 10 points in a row are below the centerline, followed by 10 points above, conclude that the process is out of…arrow_forward
- A deficiency of the trace element selenium in the diet can negatively impact growth, immunity, muscle and neuromuscular function, and fertility. The introduction of selenium supplements to dairy cows is justified when pastures have low selenium levels. Authors of a research paper supplied the following data on milk selenium concentration (mg/L) for a sample of cows given a selenium supplement (the treatment group) and a control sample given no supplement, both initially and after a 9-day period. Initial Measurement Treatment Control 11.4 9.1 9.6 8.7 10.1 9.7 8.5 10.8 10.2 10.9 10.6 10.6 11.9 10.1 9.9 12.3 10.7 8.8 10.2 10.4 10.3 10.9 11.4 10.4 9.3 11.6 10.6 10.9 10.9 8.3 After 9 Days Treatment Control 138.3 9.2 104 8.9 96.4 8.9 89 10.1 88 9.6 103.8 8.6 147.3 10.4 97.1 12.4 172.6 9.2 146.3 9.5 99 8.4 122.3 8.8 103 12.5 117.8 9.1 121.5 93 (a) Use the given data for the treatment group to determine if…arrow_forwardA deficiency of the trace element selenium in the diet can negatively impact growth, immunity, muscle and neuromuscular function, and fertility. The introduction of selenium supplements to dairy cows is justified when pastures have low selenium levels. Authors of a research paper supplied the following data on milk selenium concentration (mg/L) for a sample of cows given a selenium supplement (the treatment group) and a control sample given no supplement, both initially and after a 9-day period. Initial Measurement Treatment Control 11.3 9.1 9.7 8.7 10.1 9.7 8.5 10.8 10.4 10.9 10.7 10.6 11.8 10.1 9.8 12.3 10.6 8.8 10.4 10.4 10.2 10.9 11.3 10.4 9.2 11.6 10.7 10.9 10.8 8.2 After 9 Days Treatment Control 138.3 9.4 104 8.8 96.4 8.8 89 10.1 88 9.7 103.8 8.7 147.3 10.3 97.1 12.3 172.6 9.4 146.3 9.5 99 8.3 122.3 8.9 103 12.5 117.8 9.1 121.5 93 (a) Use the given data for the treatment group to determine if…arrow_forwardA deficiency of the trace element selenium in the diet can negatively impact growth, immunity, muscle and neuromuscular function, and fertility. The introduction of selenium supplements to dairy cows is justified when pastures have low selenium levels. Authors of a research paper supplied the following data on milk selenium concentration (mg/L) for a sample of cows given a selenium supplement (the treatment group) and a control sample given no supplement, both initially and after a 9-day period. Initial Measurement Treatment Control 11.2 9.1 9.6 8.7 10.1 9.7 8.5 10.8 10.3 10.9 10.6 10.6 11.7 10.1 9.7 12.3 10.8 8.8 10.3 10.4 10.4 10.9 11.2 10.4 9.4 11.6 10.6 10.9 10.7 8.4 After 9 Days Treatment Control 138.3 9.3 104 8.7 96.4 8.7 89 10.1 88 9.6 103.8 8.6 147.3 10.2 97.1 12.2 172.6 9.3 146.3 9.5 99 8.2 122.3 8.9 103 12.5 117.8 9.1 121.5 93 (a) Use the given data for the treatment group to determine if there…arrow_forward
- The data in the attached image represents blood pressure based on a new trial medication used in an experiment involving a total of 50 male and female subjects. There were two levels of treatment: 0 = placebo and 1 = treatment group. Family History Blood Pressure = Fam-Hist-BP; from the paternal side = PS; from the maternal side = MS; from both sides = BS; none on both sides or not known = N.; Blood pressure before the experiment = BP-Before-Exp; Blood pressure after the experiment = BP-After-Exp. Task: Construct a side-by-side boxplot to compare the variables BP-Before-Exp and BP-After-Exp.arrow_forwardThe data in the attached image represents blood pressure based on a new trial medication used in an experiment involving a total of 50 male and female subjects. There were two levels of treatment: 0 = placebo and 1 = treatment group. Family History Blood Pressure = Fam-Hist-BP; from the paternal side = PS; from the maternal side = MS; from both sides = BS; none on both sides or not known = N.; Blood pressure before the experiment = BP-Before-Exp; Blood pressure after the experiment = BP-After-Exp. Task: Construct a histogram to represent the family BP history, the subjects' BP before treatment and the subjects' BP after treatment.arrow_forwardThe data in the attached image represents blood pressure based on a new trial medication used in an experiment involving a total of 50 male and female subjects. There were two levels of treatment: 0 = placebo and 1 = treatment group. Family History Blood Pressure = Fam-Hist-BP; from the paternal side = PS; from the maternal side = MS; from both sides = BS; none on both sides or not known = N.; Blood pressure before the experiment = BP-Before-Exp; Blood pressure after the experiment = BP-After-Exp. Task: Find the mean and standard deviation for the family history group, the before treatment group, and the after treatment group.arrow_forward
- The data in the attached image represents blood pressure based on a new trial medication used in an experiment involving a total of 50 male and female subjects. There were two levels of treatment: 0 = placebo and 1 = treatment group. Family History Blood Pressure = Fam-Hist-BP; from the paternal side = PS; from the maternal side = MS; from both sides = BS; none on both sides or not known = N.; Blood pressure before the experiment = BP-Before-Exp; Blood pressure after the experiment = BP-After-Exp. Task: Generate at least two different cross tabulations.arrow_forwardIn an experiment to examine the survival of eggs of the Pipevine swallowtail butterfly on its hostplant, Aristolocia californica, in gardens and in natural populations of the plant, a student located eggs masses at garden and natural sites, and also placed mesh bags around half of the egg masses sampled at each site to test for the effects of natural enemies (e.g., predators and parasites). Analyze the data contained in the data file “pipevine.csv”. State all the hypotheses you can test and report and interpret the test results. For sitetype 1 = garden and 0 = natural. pipevine data sitename bag unbag sitetype 1 26 0.95 0.67 0 2 9 0.69 0.60 1 3 18 0.88 0.58 0 4 28 0.85 0.44 0 5 40 0.96 0.61 0 6 37 0.65 0.65 1 7 43 0.65 0.00 1 8 36 0.81 0.48 1arrow_forwardA researcher uncovers that there is a significant interaction between the factor of marital status (i.e., married or non-married) and participant sex (i.e., male or female) regarding well-being. A researcher decides to compare the difference in well-being between married men and women. What would be the null hypothesis for this comparison? a. µMale ≠ µFemale for married individuals b. µMale ≠ µFemale for non-married individuals c. µMale = µFemale for non-married individuals d. µMale = µFemale for married individualsarrow_forward
 Linear Algebra: A Modern IntroductionAlgebraISBN:9781285463247Author:David PoolePublisher:Cengage Learning
 Big Ideas Math A Bridge To Success Algebra 1: Stu...AlgebraISBN:9781680331141Author:HOUGHTON MIFFLIN HARCOURTPublisher:Houghton Mifflin Harcourt