
Videos
Here’s one to sink your teeth into: The authors of the article “Analysis of Food Crushing Sounds During Mastication: Total Sound Level Studies” (Journal of Texture Studies [1990]: 165–178) studied the nature of sounds generated during eating. Peak loudness (in decibels at 20 cm away) was measured for both open-mouth and closed-mouth chewing of potato chips and of tortilla chips. Forty subjects participated, with ten assigned at random to each combination of conditions (such as closed-mouth potato chip, and so on). We are not making this up! Summary values taken from plots given in the article appear in the accompanying table. For purposes of this exercise, suppose that it is reasonable to regard the peak loudness distributions as approximately normal.
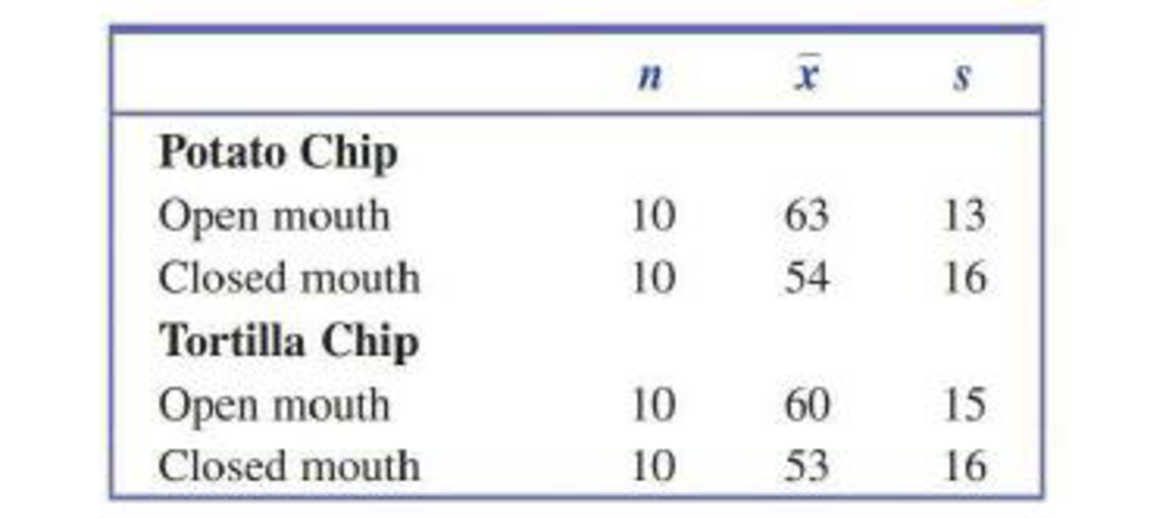
- a. Construct a 95% confidence interval tor the (inference in
mean peak loudness between open-mouth and closed-mouth chewing of potato chips. Interpret the resulting interval. - b. For closed-mouth chewing (the recommended method!), is there sufficient evidence to indicate that there is a difference between potato chips and tortilla chips with respect to mean peak loudness? Test the relevant hypotheses using α = 0.01.
- c. The means and standard deviations given here were actually for stale chips. When ten measurements of peak loudness were recorded for closed-mouth chewing of fresh tortilla chips, the resulting mean and standard deviation were 56 and 14, respectively. Is there sufficient evidence to conclude that chewing fresh tortilla chips is louder than chewing stale chips? Use α = 0.05.

Trending nowThis is a popular solution!

Chapter 11 Solutions
Introduction to Statistics and Data Analysis


- Note: The purpose of this problem below is to use computational techniques (Excelspreadsheet, Matlab, R, Python, etc.) and code the dynamic programming ideas seen inclass. Please provide the numerical answer to the questions as well as a sample of yourwork (spreadsheet, code file, etc.).We consider an N-period binomial model with the following properties: N = 60, thecurrent stock price is S0 = 1000; on each period, the stock price increases by 0.5% whenit moves up and decreases by 0.3% when it moves down. The annual interest rate on themoney market is 5%. (Notice that this model is a CRR model, which means that thebinomial tree is recombining.)(a) Find the price at time t0 = 0 of a (European) call option with strike price K = 1040and maturity T = 1 year.(b) Find the price at time t0 = 0 of a (European) put option with strike price K = 1040and maturity T = 1 year.(c) We consider now, that you are at time t5 (i.e. after 5 periods, which represents 1month later). Assume that the stock…arrow_forwardshow work in paperarrow_forwardshow all work (...or what you entered into your calculator...)arrow_forward
- answerarrow_forwardQuestion 2 The data below provides the battery life of thirty eight (38) motorcycle batteries. 100 83 83 105 110 81 114 99 101 105 78 115 74 96 106 89 94 81 106 91 93 86 79 103 94 108 113 100 117 120 77 93 93 85 76 89 78 88 680 a. Test the hypothesis that mean battery life is greater than 90. Use the 1% level of significance. b. Determine if the mean battery life is different from 80. Use the 10% level of significance. Show all steps for the hypothesis test c. Would your conlcusion in part (b) change at the 5% level of significance? | d. Confirm test results in part (b) using JASP. Note: All JASP input files and output tables should be providedarrow_forwardSuppose that 80% of athletes at a certain college graduate. You randomly select eight athletes. What’s the chance that at most 7 of them graduate?arrow_forward
- Suppose that you flip a fair coin four times. What’s the chance of getting at least one head?arrow_forwardSuppose that the chance that an elementary student eats hot lunch is 30 percent. What’s the chance that, among 20 randomly selected students, between 6 and 8 students eat hot lunch (inclusive)?arrow_forwardBob’s commuting times to work are varied. He makes it to work on time 80 percent of the time. On 12 randomly selected trips to work, what’s the chance that Bob makes it on time at least 10 times?arrow_forward
- Your chance of winning a small prize in a scratch-off ticket is 10 percent. You buy five tickets. What’s the chance you will win at least one prize?arrow_forwardSuppose that 60 percent of families own a pet. You randomly sample four families. What is the chance that two or three of them own a pet?arrow_forwardIf 40 percent of university students purchase their textbooks online, in a random sample of five students, what’s the chance that exactly one of them purchased their textbooks online?arrow_forward
 Glencoe Algebra 1, Student Edition, 9780079039897...AlgebraISBN:9780079039897Author:CarterPublisher:McGraw Hill