Task: Construct a histogram to represent the family BP history, the subjects' BP before treatment and the subjects' BP after treatment.
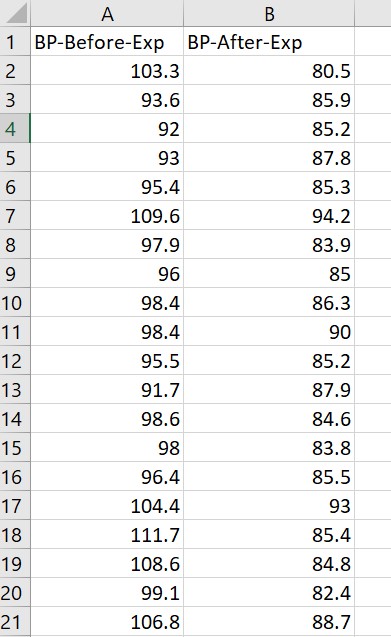
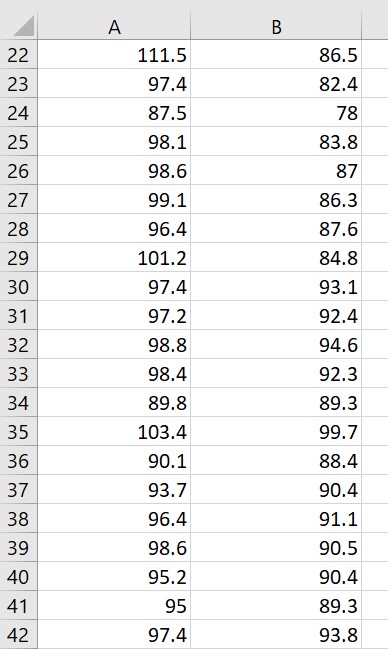
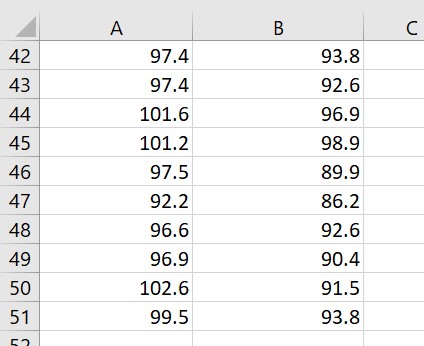
The data in the attached image represents blood pressure based on a new trial medication used in an experiment involving a total of 50 male and female subjects. There were two levels of treatment: 0 = placebo and 1 = treatment group. Family History Blood Pressure = Fam-Hist-BP; from the paternal side = PS; from the maternal side = MS; from both sides = BS; none on both sides or not known = N.; Blood pressure before the experiment = BP-Before-Exp; Blood pressure after the experiment = BP-After-Exp.
Task: Construct a histogram to represent the family BP history, the subjects' BP before treatment and the subjects' BP after treatment.

Enter the data in Excel in two columns: one for BP-Before-exp & one for BP-After-Exp:


Step by step
Solved in 3 steps with 6 images


