
Videos
Graph each system of inequalities. Verify whether the graph is bounded or unbounded.
Answer to Problem 85RE
Explanation of Solution
Given information:
Graph each system of inequalities. Tell whether the graph is bounded or unbounded, and label the corner points.
Calculation:
Consider the inequality.
To graph the given inequality, start by graphing the lines
To determine the part of the graph to be shaded use a test point
Substitute
Since
Substitute
Since
The intersection of the shaded region represents the graph of the given system of inequalities.
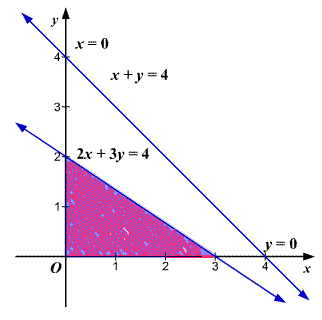
The graph of a system is said to be bounded if it can be contained within circle of sufficiently large radius. If not then it is unbounded.
The graph of a system is bounded since it can be contained within a circle.
The corner point of the graph are the point of intersection of the boundary lines. Here we have three corner points,
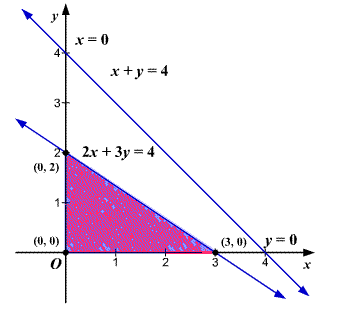
Hence, the graph is
Chapter 11 Solutions
Precalculus
Additional Math Textbook Solutions
Elementary Statistics
Thinking Mathematically (6th Edition)
Pre-Algebra Student Edition
Basic Business Statistics, Student Value Edition
Calculus for Business, Economics, Life Sciences, and Social Sciences (14th Edition)


- A 20 foot ladder rests on level ground; its head (top) is against a vertical wall. The bottom of the ladder begins by being 12 feet from the wall but begins moving away at the rate of 0.1 feet per second. At what rate is the top of the ladder slipping down the wall? You may use a calculator.arrow_forwardExplain the focus and reasons for establishment of 12.4.1(root test) and 12.4.2(ratio test)arrow_forwarduse Integration by Parts to derive 12.6.1arrow_forward
- Explain the relationship between 12.3.6, (case A of 12.3.6) and 12.3.7arrow_forwardExplain the key points and reasons for the establishment of 12.3.2(integral Test)arrow_forwardUse 12.4.2 to determine whether the infinite series on the right side of equation 12.6.5, 12.6.6 and 12.6.7 converges for every real number x.arrow_forward
- use Corollary 12.6.2 and 12.6.3 to derive 12.6.4,12.6.5, 12.6.6 and 12.6.7arrow_forwardExplain the focus and reasons for establishment of 12.5.1(lim(n->infinite) and sigma of k=0 to n)arrow_forwardExplain the focus and reasons for establishment of 12.5.3 about alternating series. and explain the reason why (sigma k=1 to infinite)(-1)k+1/k = 1/1 - 1/2 + 1/3 - 1/4 + .... converges.arrow_forward
 Calculus: Early TranscendentalsCalculusISBN:9781285741550Author:James StewartPublisher:Cengage Learning
 Thomas' Calculus (14th Edition)CalculusISBN:9780134438986Author:Joel R. Hass, Christopher E. Heil, Maurice D. WeirPublisher:PEARSON
 Calculus: Early Transcendentals (3rd Edition)CalculusISBN:9780134763644Author:William L. Briggs, Lyle Cochran, Bernard Gillett, Eric SchulzPublisher:PEARSON
 Calculus: Early TranscendentalsCalculusISBN:9781319050740Author:Jon Rogawski, Colin Adams, Robert FranzosaPublisher:W. H. Freeman
 Calculus: Early Transcendental FunctionsCalculusISBN:9781337552516Author:Ron Larson, Bruce H. EdwardsPublisher:Cengage Learning