
Videos
To graph: The system of inequalities,
Explanation of Solution
Given information:
The system of inequalities,
Graph:
An inequality
Now for the remaining inequalities,
To plot the graph of an inequality, replace inequality sign by equal sign and find the boundary curve.
If inequality is of type
Here in
An equation,
Find some ordered pairs of
For that choose
Choose
Choose
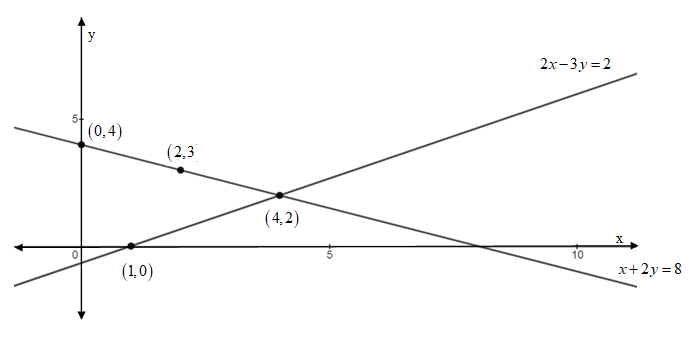
So, the two points on a line
Now an equation,
Find some ordered pairs of
Choose
Choose
So the two points on a line
Nowby connecting points on each line to draw a linethat represents a graph below:
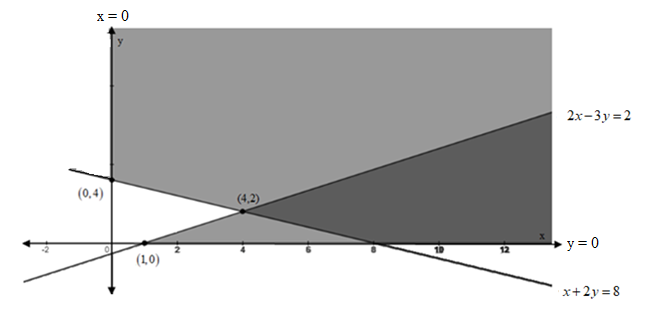
Now, to plot the graph of system of inequality
Choose a test point and substitute in inequality, if test point satisfies the inequality shade the region which includes test point otherwise shade the region which does not include test point.
For
Substitute
For
Substitute
Therefore, The graph of system of inequality
Thus the intersection of the shaded region gives the resulting graph with corner points are labeled is shown below,
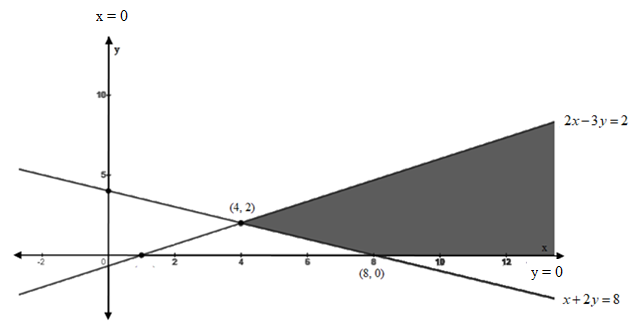
Interpretation:
The graph represents a system of inequalities,
Chapter 11 Solutions
Precalculus
Additional Math Textbook Solutions
Calculus: Early Transcendentals (2nd Edition)
Elementary Statistics
University Calculus: Early Transcendentals (4th Edition)
Introductory Statistics
Elementary Statistics: Picturing the World (7th Edition)
A First Course in Probability (10th Edition)


- A 20 foot ladder rests on level ground; its head (top) is against a vertical wall. The bottom of the ladder begins by being 12 feet from the wall but begins moving away at the rate of 0.1 feet per second. At what rate is the top of the ladder slipping down the wall? You may use a calculator.arrow_forwardExplain the focus and reasons for establishment of 12.4.1(root test) and 12.4.2(ratio test)arrow_forwarduse Integration by Parts to derive 12.6.1arrow_forward
- Explain the relationship between 12.3.6, (case A of 12.3.6) and 12.3.7arrow_forwardExplain the key points and reasons for the establishment of 12.3.2(integral Test)arrow_forwardUse 12.4.2 to determine whether the infinite series on the right side of equation 12.6.5, 12.6.6 and 12.6.7 converges for every real number x.arrow_forward
- use Corollary 12.6.2 and 12.6.3 to derive 12.6.4,12.6.5, 12.6.6 and 12.6.7arrow_forwardExplain the focus and reasons for establishment of 12.5.1(lim(n->infinite) and sigma of k=0 to n)arrow_forwardExplain the focus and reasons for establishment of 12.5.3 about alternating series. and explain the reason why (sigma k=1 to infinite)(-1)k+1/k = 1/1 - 1/2 + 1/3 - 1/4 + .... converges.arrow_forward
 Calculus: Early TranscendentalsCalculusISBN:9781285741550Author:James StewartPublisher:Cengage Learning
 Thomas' Calculus (14th Edition)CalculusISBN:9780134438986Author:Joel R. Hass, Christopher E. Heil, Maurice D. WeirPublisher:PEARSON
 Calculus: Early Transcendentals (3rd Edition)CalculusISBN:9780134763644Author:William L. Briggs, Lyle Cochran, Bernard Gillett, Eric SchulzPublisher:PEARSON
 Calculus: Early TranscendentalsCalculusISBN:9781319050740Author:Jon Rogawski, Colin Adams, Robert FranzosaPublisher:W. H. Freeman
 Calculus: Early Transcendental FunctionsCalculusISBN:9781337552516Author:Ron Larson, Bruce H. EdwardsPublisher:Cengage Learning