
Concept explainers
Videos
a.
To find: The
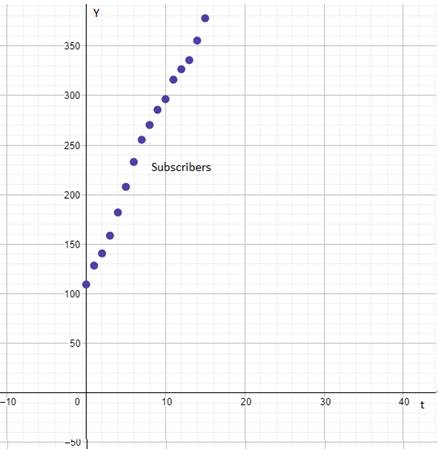
The scatter plot of the data is shown below.
Given:
The data of subscriber and number of revenue per person is shown below.
| Year | No of subscribers | Average revenue per subscriber |
| 2000 | 109.5 | 48.55 |
| 2001 | 128.4 | 49.79 |
| 2002 | 140.8 | 51 |
| 2003 | 158.7 | 51.55 |
| 2004 | 182.1 | 52.54 |
| 2005 | 207.9 | 50.65 |
| 2006 | 233 | 49.07 |
| 2007 | 255.4 | 49.26 |
| 2008 | 270.3 | 48.87 |
| 2009 | 285.6 | 47.97 |
| 2010 | 296.3 | 47.53 |
| 2011 | 316 | 46.11 |
| 2012 | 326.5 | 48.99 |
| 2013 | 335.7 | 48.79 |
| 2014 | 355.4 | 46.64 |
| 2015 | 377.9 | 44.65 |
Calculation:
The scatter plot of the data of subscribers’ verses time is shown below.

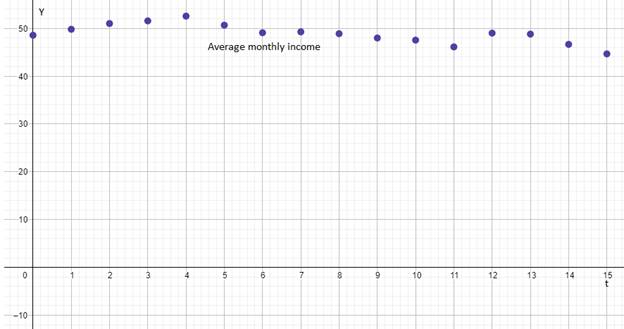
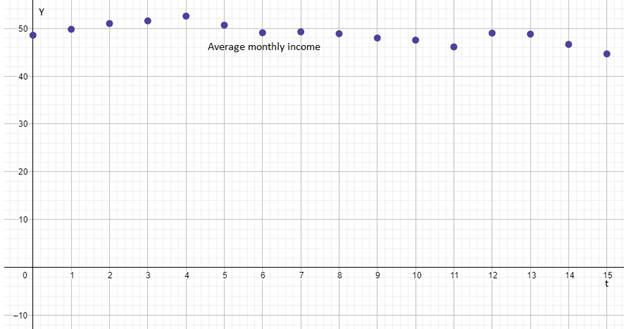
The scatter plot of the data of average monthly income verses time is shown below.
b.
To find: The slope intercept form of line for one of the scatter plots which is linear.
The slope intercept form of line is
Given:
The data of subscriber and number of revenue per person is shown below.
| Year | No of subscribers | Average revenue per subscriber |
| 2000 | 109.5 | 48.55 |
| 2001 | 128.4 | 49.79 |
| 2002 | 140.8 | 51 |
| 2003 | 158.7 | 51.55 |
| 2004 | 182.1 | 52.54 |
| 2005 | 207.9 | 50.65 |
| 2006 | 233 | 49.07 |
| 2007 | 255.4 | 49.26 |
| 2008 | 270.3 | 48.87 |
| 2009 | 285.6 | 47.97 |
| 2010 | 296.3 | 47.53 |
| 2011 | 316 | 46.11 |
| 2012 | 326.5 | 48.99 |
| 2013 | 335.7 | 48.79 |
| 2014 | 355.4 | 46.64 |
| 2015 | 377.9 | 44.65 |
The
Formula used:
Calculation:
From the graphs of subscribers verses time and average monthly revenue per subscriber verses time the graph of subscribers verses time is linear.
Calculation of slope intercepts form of line for number of subscribers.
Taking
Substitute the values in the formula
Substitute the value of
Substitute the values of
c.
To find: The best fit line and scatter plot on the same graph.
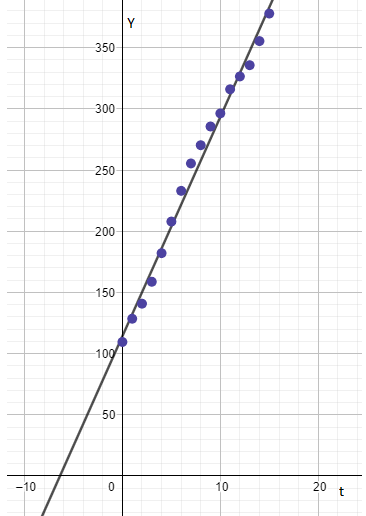
The graph representing the scatter plot and the best fit line is shown below.
Given:
The data of subscriber and number of revenue per person is shown below.
| Year | No of subscribers | Average revenue per subscriber |
| 2000 | 109.5 | 48.55 |
| 2001 | 128.4 | 49.79 |
| 2002 | 140.8 | 51 |
| 2003 | 158.7 | 51.55 |
| 2004 | 182.1 | 52.54 |
| 2005 | 207.9 | 50.65 |
| 2006 | 233 | 49.07 |
| 2007 | 255.4 | 49.26 |
| 2008 | 270.3 | 48.87 |
| 2009 | 285.6 | 47.97 |
| 2010 | 296.3 | 47.53 |
| 2011 | 316 | 46.11 |
| 2012 | 326.5 | 48.99 |
| 2013 | 335.7 | 48.79 |
| 2014 | 355.4 | 46.64 |
| 2015 | 377.9 | 44.65 |
Observation:
The graph of subscriber verses time and average monthly revenue per subscriber verses time the best fit line fits appropriately to the graph of subscribers verses time.

d.
To find: The pattern that the graph of subscribers verses time with best fit line follow.
Some points are left after the best fit has been drawn with the help of scatter points.
Given:
The data of subscriber and number of revenue per person is shown below.
| Year | No of subscribers | Average revenue per subscriber |
| 2000 | 109.5 | 48.55 |
| 2001 | 128.4 | 49.79 |
| 2002 | 140.8 | 51 |
| 2003 | 158.7 | 51.55 |
| 2004 | 182.1 | 52.54 |
| 2005 | 207.9 | 50.65 |
| 2006 | 233 | 49.07 |
| 2007 | 255.4 | 49.26 |
| 2008 | 270.3 | 48.87 |
| 2009 | 285.6 | 47.97 |
| 2010 | 296.3 | 47.53 |
| 2011 | 316 | 46.11 |
| 2012 | 326.5 | 48.99 |
| 2013 | 335.7 | 48.79 |
| 2014 | 355.4 | 46.64 |
| 2015 | 377.9 | 44.65 |
Observation:
The graph of subscriber verses time with best fit line is shown below.

From the graph it is clear that some points are left out after drawing the best fit line with the help of scatter plot points.
e.
To find: The trend that the average monthly revenue per subscriber follows from
The decreasing and increasing pattern of revenue tells that the market the price will rose and fall according to the demand and supply.
Given:
The data of subscriber and number of revenue per person is shown below.
| Year | No of subscribers | Average revenue per subscriber |
| 2000 | 109.5 | 48.55 |
| 2001 | 128.4 | 49.79 |
| 2002 | 140.8 | 51 |
| 2003 | 158.7 | 51.55 |
| 2004 | 182.1 | 52.54 |
| 2005 | 207.9 | 50.65 |
| 2006 | 233 | 49.07 |
| 2007 | 255.4 | 49.26 |
| 2008 | 270.3 | 48.87 |
| 2009 | 285.6 | 47.97 |
| 2010 | 296.3 | 47.53 |
| 2011 | 316 | 46.11 |
| 2012 | 326.5 | 48.99 |
| 2013 | 335.7 | 48.79 |
| 2014 | 355.4 | 46.64 |
| 2015 | 377.9 | 44.65 |
Observation:
From the table it is clearly visible that the average monthly revenue per subscriber follows a pattern that is decreasing and after
Chapter 1 Solutions
Precalculus: Graphical, Numerical, Algebraic Common Core 10th Edition


 Calculus: Early TranscendentalsCalculusISBN:9781285741550Author:James StewartPublisher:Cengage Learning
 Thomas' Calculus (14th Edition)CalculusISBN:9780134438986Author:Joel R. Hass, Christopher E. Heil, Maurice D. WeirPublisher:PEARSON
 Calculus: Early Transcendentals (3rd Edition)CalculusISBN:9780134763644Author:William L. Briggs, Lyle Cochran, Bernard Gillett, Eric SchulzPublisher:PEARSON
 Calculus: Early TranscendentalsCalculusISBN:9781319050740Author:Jon Rogawski, Colin Adams, Robert FranzosaPublisher:W. H. Freeman
 Calculus: Early Transcendental FunctionsCalculusISBN:9781337552516Author:Ron Larson, Bruce H. EdwardsPublisher:Cengage Learning