
Concept explainers
Videos
a)
To find: The month in which both A and L bought the stock.
Both A and L bought the stock in March.
Given Information:
The graph shown in figure 1.
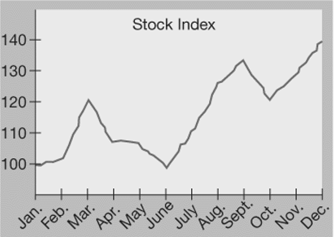
Figure 1
Explanation:
There is an increase in the price from
Therefore, both A and L would have bought the stock in March.
b)
To find: The approximate price at which A and L bought the stock.
Both A and L bought the stock at the price of
Given Information:
The graph shown in figure 1.
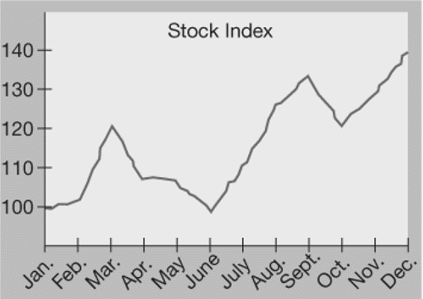
Figure 1
Explanation:
From the graph in figure 1, it follows that in March the stock price was
Therefore, both A and L bought the stock at the price of
c)
To find: When did A sell the stock.
A sold the stock in June.
Given Information:
According the A’s rule, if the stock doesn’t perform well for consecutive three months, then the person will sell the stock.
Explanation:
From the graph, it follows that from March, the prices of the stock fell continuously for three months.
Therefore, A sold the stock in June.
d)
To find: How much A loses on the stock.
A lose
Given Information:
A bought 100 shares at the price
Explanation:
A sold the shares at
A bought 100 shares at the price
The amount he lost is
Therefore, A’s total loss is
e)
To explain: Why Person L’s strategy was better for this particular stock and year over Person A’s strategy.
Given Information:
The graph shown in figure 1. Also, according the A’s rule, if the stock doesn’t perform well for consecutive three months, then the Person A will sell the stock, and according to Person L’s rule if the stock doesn’t perform well since its purchase, then Person L will sell the stock in December.
Explanation:
A sold his stock in March and since then the price of the stock is started rising again. At the end of the year, it rises to
Now, L sold her stock at the end of the year.
So, she got
She invested
Thus, she earned a profit of
Since L earned a profit of
f)
To sketch: A 12-month graph of a stock’s performance that would favor A’s strategy over L’s.
Given Information:
According the A’s rule, if the stock doesn’t perform well for consecutive three months, then the Person A will sell the stock, and according to Person L’s rule if the stock has failed to perform well since its purchase, then Person L will sell the stock in December.
Graph:
Person A’s strategy would be favoured if any graph decrease steadily from March to December.
The graph in figure 2 shows that A’s strategy is better than L’s.
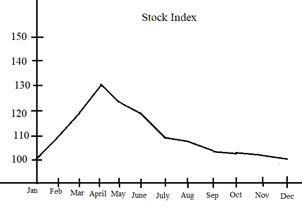
Figure 2
In this case, L sold her stock at the end of the year.
So, she got
A sold his stock in July at
Thus, A earned more than L.
Chapter 1 Solutions
Precalculus: Graphical, Numerical, Algebraic Common Core 10th Edition


- Solve this question and show steps.arrow_forwardu, v and w are three coplanar vectors: ⚫ w has a magnitude of 10 and points along the positive x-axis ⚫ v has a magnitude of 3 and makes an angle of 58 degrees to the positive x- axis ⚫ u has a magnitude of 5 and makes an angle of 119 degrees to the positive x- axis ⚫ vector v is located in between u and w a) Draw a diagram of the three vectors placed tail-to-tail at the origin of an x-y plane. b) If possible, find w × (ū+v) Support your answer mathematically or a with a written explanation. c) If possible, find v. (ū⋅w) Support your answer mathematically or a with a written explanation. d) If possible, find u. (vxw) Support your answer mathematically or a with a written explanation. Note: in this question you can work with the vectors in geometric form or convert them to algebraic vectors.arrow_forwardQuestion 3 (6 points) u, v and w are three coplanar vectors: ⚫ w has a magnitude of 10 and points along the positive x-axis ⚫ v has a magnitude of 3 and makes an angle of 58 degrees to the positive x- axis ⚫ u has a magnitude of 5 and makes an angle of 119 degrees to the positive x- axis ⚫ vector v is located in between u and w a) Draw a diagram of the three vectors placed tail-to-tail at the origin of an x-y plane. b) If possible, find w × (u + v) Support your answer mathematically or a with a written explanation. c) If possible, find v. (ū⋅ w) Support your answer mathematically or a with a written explanation. d) If possible, find u (v × w) Support your answer mathematically or a with a written explanation. Note: in this question you can work with the vectors in geometric form or convert them to algebraic vectors.arrow_forward
- K Find all values x = a where the function is discontinuous. For each value of x, give the limit of the function as x approaches a. Be sure to note when the limit doesn't exist. x-7 p(x) = X-7 Select the correct choice below and, if necessary, fill in the answer box(es) within your choice. (Use a comma to separate answers as needed.) OA. f is discontinuous at the single value x = OB. f is discontinuous at the single value x= OC. f is discontinuous at the two values x = OD. f is discontinuous at the two values x = The limit is The limit does not exist and is not co or - ∞. The limit for the smaller value is The limit for the larger value is The limit for the smaller value is The limit for the larger value does not exist and is not c∞ or -arrow_forwardK x3 +216 complete the table and use the results to find lim k(x). If k(x) = X+6 X-6 X -6.1 -6.01 - 6.001 - 5.999 - 5.99 -5.9 k(x) Complete the table. X -6.1 -6.01 - 6.001 - 5.999 - 5.99 - 5.9 k(x) (Round to three decimal places as needed.) Find the limit. Select the correct choice below and, if necessary, fill in the answer box within your choice.arrow_forwardSketch the slope field that represents the differential equation. × Clear Undo Redo y ४|० || 33 dy dxarrow_forward
- Sketch the slope field that represents the differential equation. × Clear Undo Redo dy 33 dx = -y "arrow_forwardMath Test 3 3 x³+y³ = Ꭹ = 9 2 2 x²+y² = 5 x+y=?arrow_forwardFor each of the following series, determine whether the absolute convergence series test determines absolute convergence or fails. For the ¿th series, if the test is inconclusive then let Mi = 4, while if the test determines absolute convergence let Mi 1 : 2: ∞ Σ(−1)"+¹ sin(2n); n=1 Σ n=1 Σ ((−1)”. COS n² 3+2n4 3: (+ 4: 5 : n=1 ∞ n 2+5n3 ПП n² 2 5+2n3 пп n² Σ(+)+ n=1 ∞ n=1 COS 4 2 3+8n3 П ηπ n- (−1)+1 sin (+727) 5 + 2m³ 4 = 8. Then the value of cos(M₁) + cos(2M2) + cos(3M3) + sin(2M) + sin(M5) is -0.027 -0.621 -1.794 -1.132 -1.498 -4.355 -2.000 2.716arrow_forward
- i need help with this question i tried by myself and so i am uploadding the question to be quided with step by step solution and please do not use chat gpt i am trying to learn thank you.arrow_forwardi need help with this question i tried by myself and so i am uploadding the question to be quided with step by step solution and please do not use chat gpt i am trying to learn thank you.arrow_forward1. 3 2 fx=14x²-15x²-9x- 2arrow_forward
 Calculus: Early TranscendentalsCalculusISBN:9781285741550Author:James StewartPublisher:Cengage Learning
 Thomas' Calculus (14th Edition)CalculusISBN:9780134438986Author:Joel R. Hass, Christopher E. Heil, Maurice D. WeirPublisher:PEARSON
 Calculus: Early Transcendentals (3rd Edition)CalculusISBN:9780134763644Author:William L. Briggs, Lyle Cochran, Bernard Gillett, Eric SchulzPublisher:PEARSON
 Calculus: Early TranscendentalsCalculusISBN:9781319050740Author:Jon Rogawski, Colin Adams, Robert FranzosaPublisher:W. H. Freeman
 Calculus: Early Transcendental FunctionsCalculusISBN:9781337552516Author:Ron Larson, Bruce H. EdwardsPublisher:Cengage Learning