
(a)
Interpretation:
State that the copper element A or element B is labeled in given phase diagram of copper-silver metals.
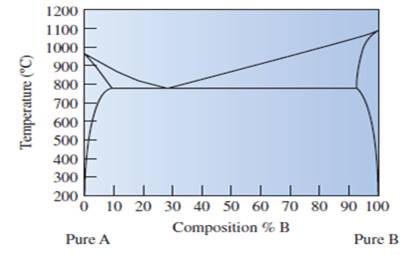
Fig.
Concept Introduction:
The properties of the copper-silver alloy are as follows-
1. Melting point −
2. Molecular weight −
3. Density −
4. Insoluble in water
In the case of silver and copper alloy, both of these are not able to melt together and form a new alloy with
1. Sterling silver − In sterling silver, the weight percentage of pure silver is
2. Coin silver - The weight percentage of pure silver available in coin silver is
There is a new alloy also available known as Electrum. In this alloy, the weight percentage of silver is from
(b)
Interpretation:
The well labelled phase diagram of the copper silver alloy needs to be sketched.
Concept Introduction:
The properties of the copper-silver alloy are as follows-
1. Melting point −
2. Molecular weight −
3. Density −
4. Insoluble in water
In the case of silver and copper alloy, both of these are not able to melt together and form a new alloy with
1. Sterling silver − In sterling silver, the weight percentage of pure silver is
2. Coin silver - The weight percentage of pure silver available in coin silver is
There is a new alloy also available known as Electrum. In this alloy, the weight percentage of silver is from
(c)
Interpretation:
Whether the new composition is stronger or weaker needs to be determined, if it cools down at
Concept Introduction:
The properties of the copper-silver alloy are as follows-
1. Melting point −
2. Molecular weight −
3. Density −
4. Insoluble in water
In the case of silver and copper alloy, both of these are not able to melt together and form a new alloy with
1. Sterling silver − In sterling silver, the weight percentage of pure silver is
2. Coin silver - The weight percentage of pure silver available in coin silver is
There is a new alloy also available known as Electrum. In this alloy, the weight percentage of silver is from
(d)
Interpretation:
The statement "microstructure can lead to the discrepancy" needs to be justified by giving an example.
Concept Introduction:
The properties of the copper-silver alloy are as follows-
1. Melting point −
2. Molecular weight −
3. Density −
4. Insoluble in water
In the case of silver and copper alloy, both of these are not able to melt together and form a new alloy with
1. Sterling silver − In sterling silver, the weight percentage of pure silver is
2. Coin silver - The weight percentage of pure silver available in coin silver is
There is a new alloy also available known as Electrum. In this alloy, the weight percentage of silver is from

Trending nowThis is a popular solution!

Chapter 11 Solutions
Essentials Of Materials Science And Engineering

- A3Q3.c - You are to write a C program that implements the following disk scheduling algorithms: a. FCFS [10 marks] b. SCAN [10 marks] c. C-SCAN [10 marks] d. SSTF [10 marks] e. LOOK [10 marks] f. C-LOOK [10 marks] • Your program will service a disk with 300 cylinders numbered 0 to 299. • • • • The program will service the requests (a list of 20 cylinder numbers) given in the file request.bin. This file contains (4 byte) integer values representing requests ranging from 0-299. Your program will take the initial position of the disk head as the first command line argument and the direction of the head as the second command line argument. It will then output the requests in the order in which they are serviced, and the total amount of head movements required by each algorithm. In particular, your program needs to do the following: Your program should take two command line arguments a) First command line argument - initial position of the disk head (an integer value) b) Second command line…arrow_forwardQuestion 3 (20 points): The traffic volume on a 2-lane highway is 1600 veh/hr in each direction Page 3 of 6 with a density of 20 veh/mi. A large dump truck enters the traffic stream from an adjacent construction site at 20 mph and carries on this way for 2 miles before turning off to the dump site. Because flow is so high in the opposite direction, no one can pass the truck. As a result, traffic back up behind the truck at four times the density (i.e., 4x20 = 80 veh/mi) at a volume of 1000 veh/hr. How many vehicles get caught in the traffic congestion before the truck exits the highway?arrow_forward1. Determine the z-transform, including the region of convergence (ROC), of the following signals: a)x[n={3,0,0,0,0,51-4} b) x2[n] = ((1/3)^n ,n ≥0 2", n < 0 c) X3[n]= (1/3)^n- 2", n ≥ 0 0, n < 0arrow_forward
- A Brayton cycle produces 14 MW with an inlet state of 17°C, 100 kPa, and a compression ratio of 16:1. The heat added in the combustion is 960 kJ/kg. 0.7 MW of heat transferred from the turbine to the environment. What are the highest temperature and the mass flow rate of air? Assume cold air properties.arrow_forwardUse ECL configuration to realize a 2-inputs OR /NOR gate and verify its function using the truth table, showing the state of each transistor in the circuit. Assume Vcc 5V, VEE-0V & VREF=1.5V.arrow_forward2. The memory management has contiguous memory allocation, dynamic partitions, and paging. Compare the internal fragmentation and external fragmentation for these three approaches. [2 marks] 3. Suppose we have Logical address space = 24 = 16 (m = 4), Page size=2² =4 (n = 2), Physical address space = 26 = 64 (r = 6). Answer the following questions: [4 marks] 1) Total # of pages ? 2) Total # of frames ? 3) Number of bits to represent logical address? 4) Number of bits to represent offset ? 5) Number of bits to represent physical address? 6) Number of bits to represent a page number? 7) Number of bits to represent a frame number / 4. What is translation look-aside buffers (TLBS)? Why we need them to implement the page table? [2 marks] 5. Why we need shared pages for multiple processes? Give one example to show the benefits. [2 marks] 6. How to implement the virtual memory by using page out and page in? Explain with an example. [2 marks] 7. We have a reference string of referenced page…arrow_forward
- . A gas turbine with air enters the compressor at 300 K, 1 bar, and exits from the turbine at 750 K, 1 bar. The thermal efficiency of the cycle is 40.1% and the back work ratio (BWR) is 0.4. Find the pressure ratio of the cycle. Assume variable specific heat.arrow_forwardA regenerative gas turbine power plant is shown in Fig. below. Air enters the compressor at 1 bar, 27°C with a mass flow rate of 0.562 kg/s and is compressed to 4 bar. The isentropic efficiency of the compressor is 80%, and the regenerator effectiveness is 90%. All the power developed by the high-pressure turbine is used to run the compressor. The low-pressure turbine provides the net power output. Each turbine has an isentropic efficiency of 87% and the temperature at the inlet to the highpressure turbine is 1200 K. Assume cold air properties, determine: a. The net power output, in kW. b. The thermal efficiency of the cycle.arrow_forwardTwenty-five signals, ten of them have 3.4 kHz bandwidth, the other have bandwidth of 5 kHz are FDM/TDM multiplexed then modulated by an RF carrier of 800 kHz using AM modulator: Calculate minimum multiplexing and transmission bandwidths. Calculate the guard band (BWGuard) to be added between each two signals and below the first one to result a multiplexing bandwidth of 131.5 kHzarrow_forward
- An FDM is used to multiplex two groups of signals using AM-SSB, the first group contains 25 speech signals, each has maximum frequency of 4 kHz, the second group contains 15 music signals, each has maximum frequency of 10 kHz. A guard bandwidth of 500 Hz is used between each two signals and before the first one. 1. Find the BWmultiplexing 2. Find the BWtransmission if the multiplexing signal is modulated using AM-DSB-LC.arrow_forwardA single tone is modulated using FM transmitter. The SNR; at the input of the demodulator Is 20 dB. If the maximum frequency of the modulating signal is 4 kHz, and the maximum frequency deviation is 12 kHz, find the SNR, and the bandwidth (using Carson rule) at the following conditions: 1. For the given values of fm and Af. 2. If the amplitude of the modulating signal is increased by 80%. 3. If the amplitude of the modulating signal is decreased by 50%, and frequency of modulating signal is increased by 50%.arrow_forward8. List three HDD scheduling algorithms. [2 marks] 9. True or False? The NVM has the same scheduling algorithms with HDD. Explain why? [2 marks] 10. Why the modern mouses use polling to detect movements instead of interrupts? [2 marks] 11. What is thrashing? How does it happen? [2 marks] 12. Given a reference string of page numbers 7, 0, 1, 2, 0, 3, 0, 4, 2, 3, 0, 3, 0, 3, 2, 1, 2, 0, 1, 7, 0, 1 and 4 frames show how the page replacement algorithms work, and how many page faults? [6 marks], 1) FIFO algorithm? [2 marks] 2) Optimal algorithm? [2 marks] 3) LRU algorithm? [2 marks] 13. List at least three file systems that you know. [2 marks] 14. In C programming, how the seek to a specific position in the file by offset? [2 marks]arrow_forward
 MATLAB: An Introduction with ApplicationsEngineeringISBN:9781119256830Author:Amos GilatPublisher:John Wiley & Sons Inc
 Essentials Of Materials Science And EngineeringEngineeringISBN:9781337385497Author:WRIGHT, Wendelin J.Publisher:Cengage,
 Industrial Motor ControlEngineeringISBN:9781133691808Author:Stephen HermanPublisher:Cengage Learning
 Basics Of Engineering EconomyEngineeringISBN:9780073376356Author:Leland Blank, Anthony TarquinPublisher:MCGRAW-HILL HIGHER EDUCATION
 Structural Steel Design (6th Edition)EngineeringISBN:9780134589657Author:Jack C. McCormac, Stephen F. CsernakPublisher:PEARSON
 Fundamentals of Materials Science and Engineering...EngineeringISBN:9781119175483Author:William D. Callister Jr., David G. RethwischPublisher:WILEY