
(a)
Interpretation:
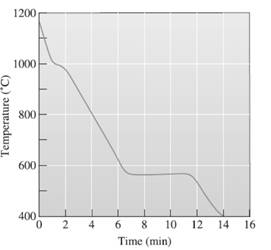
The pouring temperature needs to be determined, from the provided temperature vs time, cooling curve for Al-Si.
Concept Introduction:
A cooling curve is a schematic representation of phase change of matter, characteristically from liquid to solid or gaseous to solid.
The temperature is plotted on Y-axis.
The time is plotted on X-axis.
In this variable, time is independent variable and temperature is a dependent variable.
The initial point of the graph is designated as 'pouring temperature'.

(b)
Interpretation:
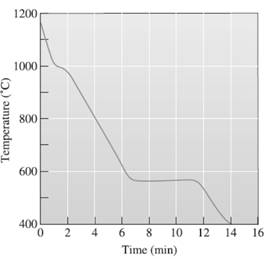
The superheat temperature needs to be determined.
Concept Introduction:
A cooling curve is a schematic representation of phase change of matter, characteristically from liquid to solid or gaseous to solid.
The temperature is plotted on Y-axis.
The time is plotted on X-axis.
In this variable, time is independent variable and temperature is a dependent variable.
The initial point of the graph is designated as 'pouring temperature'.

(c)
Interpretation:
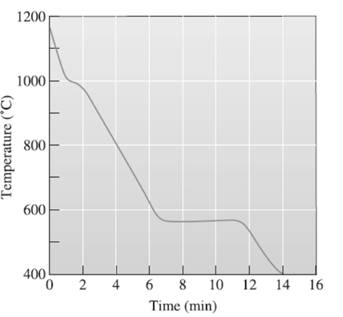
The liquidus temperature needs to be determined.
Concept Introduction:
A cooling curve is a schematic representation of phase change of matter, characteristically from liquid to solid or gaseous to solid.
The temperature is plotted on Y-axis.
The time is plotted on X-axis.
In this variable, time is independent variable and temperature is a dependent variable.
The initial point of the graph is designated as 'pouring temperature'.
(d)
Interpretation:
The eutectic temperature needs to be determined.
Concept Introduction:
A cooling curve is a schematic representation of phase change of matter, characteristically from liquid to solid or gaseous to solid.
The temperature is plotted on Y-axis.
The time is plotted on X-axis.
In this variable, time is independent variable and temperature is a dependent variable.
The initial point of the graph is designated as 'pouring temperature'.

(e)
Interpretation:
The freezing range temperature needs to be determined.
Concept Introduction:
A cooling curve is a schematic representation of phase change of matter, characteristically from liquid to solid or gaseous to solid.
The temperature is plotted on Y-axis.
The time is plotted on X-axis.
In this variable, time is independent variable and temperature is a dependent variable.
The initial point of the graph is designated as 'pouring temperature'.
(f)
Interpretation:
The local solidification time needs to be determined.
Concept Introduction:
A cooling curve is a schematic representation of phase change of matter, characteristically from liquid to solid or gaseous to solid.
The temperature is plotted on Y-axis.
The time is plotted on X-axis.
In this variable, time is independent variable and temperature is a dependent variable.
The initial point of the graph is designated as 'pouring temperature'.

(g)
Interpretation:
The total solidification temperature needs to be determined.
Concept Introduction:
A cooling curve is a schematic representation of phase change of matter, characteristically from liquid to solid or gaseous to solid.
The temperature is plotted on Y-axis.
The time is plotted on X-axis.
In this variable, time is independent variable and temperature is a dependent variable.
The initial point of the graph is designated as 'pouring temperature'.
(h)
Interpretation:
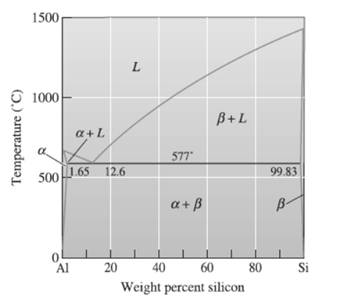
The composition of alloy needs to be determined.
Concept Introduction:
Phase diagram is used to represent the

Trending nowThis is a popular solution!

Chapter 11 Solutions
Essentials Of Materials Science And Engineering

- 1.0 m (Eccentricity in one direction only) = 0.15 m Qall = 0 1.5 m x 1.5 m Centerline An eccentrically loaded foundation is shown in the figure above. Use FS of 4 and determine the maximum allowable load that the foundation can carry if y = 16 kN/m³ and ' = 35°. Use Meyerhof's effective area method. For o' = 35°, N₁ = 33.30 and Ny = 48.03. (Enter your answer to three significant figures.) Qall kNarrow_forwardFigure 2 3) *** The circuit of Figure 3 is designed with W/L = 20/0.18, λ= 0, and ID = 0.25 mA. (Optional- 20 points) a) Compute the required gate bias voltage. b) With such a gate voltage, how much can W/L be increased while M1 remains in saturation? What is the maximum voltage gain that can be achieved as W/L increases? VDD = 1.8 V RD 2k - Vout Vin M₁ Figure 3arrow_forward1) Rs = 4kQ, R₁ = 850 kQ, R₂ = 350 kQ, and R₁ = 4 kQ. The transistor parameters are VTP = -12 V, K'p = 40 µA / V², W/L = 80, and λ = 0.05 V-1. (50 Points) a) Determine IDQ and VSDQ. b) Find the small signal voltage gain. (Av) c) Determine the small signal circuit transconductance gain. (Ag = io/vi) d) Find the small signal output resistance. VDD = 10 V 2'; www www Figure 1 Ссarrow_forward
- 4- In the system shown in the figure, the water velocity in the 12 in. diameter pipe is 8 ft/s. Determine the gage reading at position 1. Elevation 170 ft 1 Elevation 200 ft | 8 ft, 6-in.-diameter, 150 ft, 12-in.-diameter, f = 0.020 f = 0.020 A B Hints: the minor losses should consider the contraction loss at A and the expansion loss at B.arrow_forwardWhat is the moment of Inertia of this body? What is Ixx, Iyy, and Izzarrow_forwardQ11arrow_forward
- Methyl alcohol at 25°C (ρ = 789 kg/m³, μ = 5.6 × 10⁻⁴ kg/m∙s) flows through the system below at a rate of 0.015 m³/s. Fluid enters the suction line from reservoir 1 (left) through a sharp-edged inlet. The suction line is 10 cm commercial steel pipe, 15 m long. Flow passes through a pump with efficiency of 76%. Flow is discharged from the pump into a 5 cm line, through a fully open globe valve and a standard smooth threaded 90° elbow before reaching a long, straight discharge line. The discharge line is 5 cm commercial steel pipe, 200 m long. Flow then passes a second standard smooth threaded 90° elbow before discharging through a sharp-edged exit to reservoir 2 (right). Pipe lengths between the pump and valve, and connecting the second elbow to the exit are negligibly short compared to the suction and discharge lines. Volumes of reservoirs 1 and 2 are large compared to volumes extracted or supplied by the suction and discharge lines. Calculate the power that must be supplied to the…arrow_forwardQ15arrow_forwardQ17arrow_forward
- Q13arrow_forwardDo question 9 please! Question 7 Is just there for reference!!arrow_forward2) The transistor parameters of the NMOS device in the common-gate amplifier in Figure 2 are VTN = 0.4V, K'n = 100 μA / V², and λ=0. (50 points) a) Find RD such that VDSQ = VDs (sat) + 0.25V. b) Determine the transistor W/L ratio such that the small-signal voltage gain is Av=6. c) What is the value of VGSQ? Сс 2 mA Rp T V=-1.8 V V+= 1.8 V Figure 2arrow_forward
 MATLAB: An Introduction with ApplicationsEngineeringISBN:9781119256830Author:Amos GilatPublisher:John Wiley & Sons Inc
 Essentials Of Materials Science And EngineeringEngineeringISBN:9781337385497Author:WRIGHT, Wendelin J.Publisher:Cengage,
 Industrial Motor ControlEngineeringISBN:9781133691808Author:Stephen HermanPublisher:Cengage Learning
 Basics Of Engineering EconomyEngineeringISBN:9780073376356Author:Leland Blank, Anthony TarquinPublisher:MCGRAW-HILL HIGHER EDUCATION
 Structural Steel Design (6th Edition)EngineeringISBN:9780134589657Author:Jack C. McCormac, Stephen F. CsernakPublisher:PEARSON
 Fundamentals of Materials Science and Engineering...EngineeringISBN:9781119175483Author:William D. Callister Jr., David G. RethwischPublisher:WILEY