
Concept explainers
Videos
a.
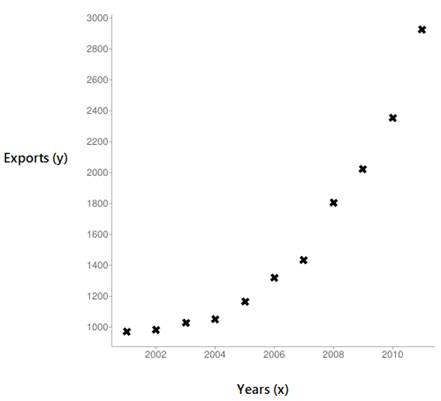
To Sketch: The
Given:
The average U.S. exports of the product for the years
| Year | Exports |
Graph:
Let
Use the instruction to generate a scatter diagram for a set of data:
Press the data column and
And Press the
To clear the graph and enter a new data set, press
The scatter plot for the given data with years in
b.
To Model: Superimpose the parabolic curve on the scatter plot using quadratic regression with a quadratic function. Analyse whether it is good fit or not.
The quadratic function is
Given:
The average U.S. exports of the product for the years
| Year | Exports |
Calculation:
Compute the Quadratic regression equation for the provided data using Ti-83 calculator as follow:
Press
Press
The screenshot is as follows:
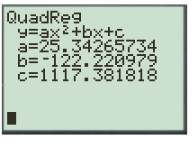
Thus, the quadratic function is
Superimpose the parabolic curve on the scatter plot:
Enter the model
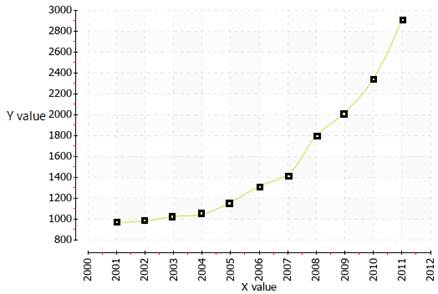
Thus, the fit is very good since the graph usually passes through the points.
c.
To Determine: The number thousands of barrels of oil the country will export per day in
Approximately
Given:
The average U.S. exports of the product for the years
| Year | Exports |
Calculation:
Let, the number of years be
To find the number of gallons of oil will be produced per day in
So, subtract the initial year
Now, substitute
Round to the approximate values:
Thus, approximately
Chapter 1 Solutions
PRECALCULUS:...COMMON CORE ED.-W/ACCESS


- Calculus lll May I please have the all properties of the dot product? Thank youarrow_forwardFind the tangent line approximation 7 to the graph of f at the given point. T(x) = f(x) = csc(x), (8, csc(8)) Complete the table. (Round your answers to four decimal places.) x f(x) T(x) 7.9 7.99 8 8.01 8.1arrow_forwardCan you solve it numerical methodarrow_forward
- Use the information to find and compare Ay and dy. (Round your answers to four decimal places.) Function x-Value Differential of x Ду = dy = y = x² + 2 x = -4 Ax = dx = 0.01arrow_forwardCalculus lll May I please have the statements with blank lines completed; furthermore, may I please have the text box completed? Thank youarrow_forwardCalculus lll May I please have the statements completed for the following text lines and box? Thank you so much,arrow_forward
- Calculus lll May I please have the solution for the following exercise? Thank you so mucharrow_forwardCalculus lll May I please have the solution for the following exercise? Thank you so much,arrow_forwardCalculus lll May I please have the solution for the following exercise? Thank you so mucharrow_forward
- Calculus lll May I please have the solution for the following example? Thank youarrow_forwardCalculus lll May I please have the statement completed for the following box? Thank you so much,arrow_forwardCalculus lll May I please have the solution for the following exercise? Thank you so mucharrow_forward
 Calculus: Early TranscendentalsCalculusISBN:9781285741550Author:James StewartPublisher:Cengage Learning
 Thomas' Calculus (14th Edition)CalculusISBN:9780134438986Author:Joel R. Hass, Christopher E. Heil, Maurice D. WeirPublisher:PEARSON
 Calculus: Early Transcendentals (3rd Edition)CalculusISBN:9780134763644Author:William L. Briggs, Lyle Cochran, Bernard Gillett, Eric SchulzPublisher:PEARSON
 Calculus: Early TranscendentalsCalculusISBN:9781319050740Author:Jon Rogawski, Colin Adams, Robert FranzosaPublisher:W. H. Freeman
 Calculus: Early Transcendental FunctionsCalculusISBN:9781337552516Author:Ron Larson, Bruce H. EdwardsPublisher:Cengage Learning