
Concept explainers
Videos
a.
To graph: The
a.
Explanation of Solution
Given information:
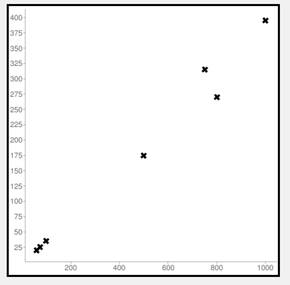
The table that depicts number of jigsaw puzzle pieces and the number of minutes taken by person to complete it.
Graph:
Consider the table that depicts number of jigsaw puzzle pieces and the number of minutes taken by person to complete it.
Let x denote the number of pieces and y denote the time in minutes.
On the coordinate plane plot the ordered pairs.
Interpretation:
When these cross are joined by a line these cross lie on a straight line. There is some relationship between number of pieces and time required to join these pieces.
b.
To describe: The scatter plot between the number of jigsaw puzzle pieces and the number of minutes taken by person to complete itwill show a positive, negative or no relationship.
b.
Answer to Problem 1.6.4EP
The scatter plot between the number of jigsaw puzzle pieces and the number of minutes taken by person to complete itwill show positive relationship.
Explanation of Solution
Given information:
The number of jigsaw puzzle pieces and the number of minutes taken by person to complete it.
When the relationship between two data sets is to be analyzed scatter plot is used.
Consider the table that depicts number of jigsaw puzzle pieces and the number of minutes taken by person to complete it.
Let x denote the number of pieces and y denote the time in minutes.
On the coordinate plane plot the ordered pairs.

When these cross are joined by a line these cross lie on a straight line. There is some relationship between number of pieces and time required to join these pieces.
As the number of pieces increase the time taken also increase.
It is observed that there is a positive relationship between x and y.
Thus, the scatter plot between number of jigsaw puzzle pieces and the number of minutes taken by person to complete itshow a positive relationship.
c.
To describe: The time taken to complete the puzzle with 650 pieces.
c.
Answer to Problem 1.6.4EP
The time taken to complete the puzzle with 650 pieces is approximately
Explanation of Solution
Given information:
The number of jigsaw puzzle pieces and the number of minutes taken by person to complete it.
When the relationship between two data sets is to be analyzed scatter plot is used.
Consider the table that depicts number of jigsaw puzzle pieces and the number of minutes taken by person to complete it.
The time required to join 60 pieces is 20 minutes.
So, the time required to place 1 piece is
The time taken to join 2 pieces is
Therefore, time taken to join 650 pieces is
Thus, the time taken to complete the puzzle with 650 pieces is approximately
Chapter SH Solutions
Pre-Algebra Student Edition
Additional Math Textbook Solutions
Basic Business Statistics, Student Value Edition
Thinking Mathematically (6th Edition)
Introductory Statistics
University Calculus: Early Transcendentals (4th Edition)
College Algebra (7th Edition)


- Solve questions by Course Name (Ordinary Differential Equations II 2)arrow_forwardplease Solve questions by Course Name( Ordinary Differential Equations II 2)arrow_forwardInThe Northern Lights are bright flashes of colored light between 50 and 200 miles above Earth. Suppose a flash occurs 150 miles above Earth. What is the measure of arc BD, the portion of Earth from which the flash is visible? (Earth’s radius is approximately 4000 miles.)arrow_forward
- e). n! (n - 1)!arrow_forwardSuppose you flip a fair two-sided coin four times and record the result. a). List the sample space of this experiment. That is, list all possible outcomes that could occur when flipping a fair two-sided coin four total times. Assume the two sides of the coin are Heads (H) and Tails (T).arrow_forwarde). n! (n - 1)!arrow_forward
- Evaluate the following expression and show your work to support your calculations. a). 6! b). 4! 3!0! 7! c). 5!2! d). 5!2! e). n! (n - 1)!arrow_forwardAmy and Samiha have a hat that contains two playing cards, one ace and one king. They are playing a game where they randomly pick a card out of the hat four times, with replacement. Amy thinks that the probability of getting exactly two aces in four picks is equal to the probability of not getting exactly two aces in four picks. Samiha disagrees. She thinks that the probability of not getting exactly two aces is greater. The sample space of possible outcomes is listed below. A represents an ace, and K represents a king. Who is correct?arrow_forwardConsider the exponential function f(x) = 12x. Complete the sentences about the key features of the graph. The domain is all real numbers. The range is y> 0. The equation of the asymptote is y = 0 The y-intercept is 1arrow_forward
- The graph shows Alex's distance from home after biking for x hours. What is the average rate of change from -1 to 1 for the function? 4-2 о A. -2 О B. 2 О C. 1 O D. -1 ty 6 4 2 2 0 X 2 4arrow_forwardWrite 7. √49 using rational exponents. ○ A. 57 47 B. 7 O C. 47 ○ D. 74arrow_forwardCan you check If my short explantions make sense because I want to make sure that I describe this part accuratelyarrow_forward
 Algebra and Trigonometry (6th Edition)AlgebraISBN:9780134463216Author:Robert F. BlitzerPublisher:PEARSON
 Contemporary Abstract AlgebraAlgebraISBN:9781305657960Author:Joseph GallianPublisher:Cengage Learning
 Linear Algebra: A Modern IntroductionAlgebraISBN:9781285463247Author:David PoolePublisher:Cengage Learning
 Algebra And Trigonometry (11th Edition)AlgebraISBN:9780135163078Author:Michael SullivanPublisher:PEARSON
 Introduction to Linear Algebra, Fifth EditionAlgebraISBN:9780980232776Author:Gilbert StrangPublisher:Wellesley-Cambridge Press
 College Algebra (Collegiate Math)AlgebraISBN:9780077836344Author:Julie Miller, Donna GerkenPublisher:McGraw-Hill Education