
Videos
(a)
To Explain: the state appropriate hypothesis for the quality-control department to test.
(a)
Answer to Problem 67E
Explanation of Solution
Given:
Claim is that
The null hypothesis states that the population value is equal to the value mentioned in the claim:
The claim is either the null hypothesis or the alternative hypothesis. The null hypothesis statement is that the population mean is equal to the value given in the claim. If the null hypothesis is the claim, then the alternative hypothesis statement is the opposite of the null hypothesis.
13y
(b)
To find: the conditions for performing the test in part (a) are met.
(b)
Answer to Problem 67E
Large sample condition is not satisfied.
Explanation of Solution
Given:
The three conditions are Random, independent (10% condition), Normal/ Large sample.
Random: Satisfied, because the tablets were randomly selected.
Independent: Satisfied, because sample of 20 tables is than 10% of the population of all tablets
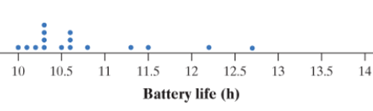
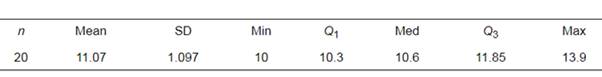
Normal/ Large sample: Not satisfied, because the sample of 20 tablets is small and the distribution in the dot plot is strongly skewed.
Since the Normal/Large sample condition is not satisfied it is not appropriate to perform a hypothesis test for the population mean.
Chapter 9 Solutions
PRACTICE OF STATISTICS F/AP EXAM
Additional Math Textbook Solutions
Pre-Algebra Student Edition
Intro Stats, Books a la Carte Edition (5th Edition)
Algebra and Trigonometry (6th Edition)
Elementary Statistics
A Problem Solving Approach To Mathematics For Elementary School Teachers (13th Edition)
Calculus for Business, Economics, Life Sciences, and Social Sciences (14th Edition)


- Find the critical value for a left-tailed test using the F distribution with a 0.025, degrees of freedom in the numerator=12, and degrees of freedom in the denominator = 50. A portion of the table of critical values of the F-distribution is provided. Click the icon to view the partial table of critical values of the F-distribution. What is the critical value? (Round to two decimal places as needed.)arrow_forwardA retail store manager claims that the average daily sales of the store are $1,500. You aim to test whether the actual average daily sales differ significantly from this claimed value. You can provide your answer by inserting a text box and the answer must include: Null hypothesis, Alternative hypothesis, Show answer (output table/summary table), and Conclusion based on the P value. Showing the calculation is a must. If calculation is missing,so please provide a step by step on the answers Numerical answers in the yellow cellsarrow_forwardShow all workarrow_forward
- Show all workarrow_forwardplease find the answers for the yellows boxes using the information and the picture belowarrow_forwardA marketing agency wants to determine whether different advertising platforms generate significantly different levels of customer engagement. The agency measures the average number of daily clicks on ads for three platforms: Social Media, Search Engines, and Email Campaigns. The agency collects data on daily clicks for each platform over a 10-day period and wants to test whether there is a statistically significant difference in the mean number of daily clicks among these platforms. Conduct ANOVA test. You can provide your answer by inserting a text box and the answer must include: also please provide a step by on getting the answers in excel Null hypothesis, Alternative hypothesis, Show answer (output table/summary table), and Conclusion based on the P value.arrow_forward
 MATLAB: An Introduction with ApplicationsStatisticsISBN:9781119256830Author:Amos GilatPublisher:John Wiley & Sons Inc
 Probability and Statistics for Engineering and th...StatisticsISBN:9781305251809Author:Jay L. DevorePublisher:Cengage Learning
 Statistics for The Behavioral Sciences (MindTap C...StatisticsISBN:9781305504912Author:Frederick J Gravetter, Larry B. WallnauPublisher:Cengage Learning
 Elementary Statistics: Picturing the World (7th E...StatisticsISBN:9780134683416Author:Ron Larson, Betsy FarberPublisher:PEARSON
 The Basic Practice of StatisticsStatisticsISBN:9781319042578Author:David S. Moore, William I. Notz, Michael A. FlignerPublisher:W. H. Freeman
 Introduction to the Practice of StatisticsStatisticsISBN:9781319013387Author:David S. Moore, George P. McCabe, Bruce A. CraigPublisher:W. H. Freeman