Concept explainers
Videos
Retail inventory method; various applications
• LO9–3 through LO9–5
On January 1, 2018, Pet Friendly Stores adopted the retail inventory method. Inventory transactions at both cost and retail, and cost indexes for 2018 and 2019 are as follows:
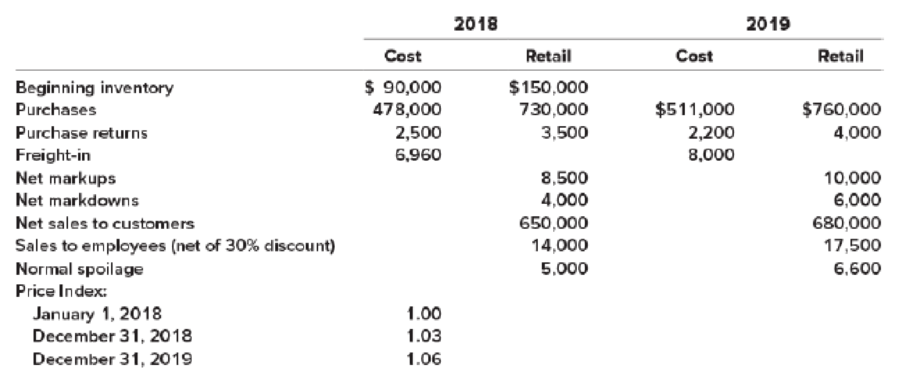
Required:
- 1. Estimate the 2018 and 2019 ending inventory and cost of goods sold using the dollar-value LIFO retail method.
- 2. Estimate the 2018 ending inventory and cost of goods sold using the average cost retail method.
- 3. Estimate the 2018 ending inventory and cost of goods sold using the conventional retail method.
1.
Dollar-Value-LIFO
This method shows all the inventory figures at dollar price rather than units. Under this inventory method, the units that are purchased last, are sold first. Thus, it starts from the selling of the units recently purchased and ending with the beginning inventory.
To Estimate: the ending inventory and cost of goods sold in 2018 using dollar-value LIFO retail method.
Explanation of Solution
Calculate the amount of estimated ending inventory and cost of goods sold at retail.
| Details | Cost ($) | Retail ($) |
| Beginning inventory | 90,000 | 150,000 |
| Add: Net purchase | 478,000 | 730,000 |
| Freight-in | 6,960 | |
| Net markups | 8,500 | |
| Less: Net markdowns | (4,000) | |
| Purchase returns | (2,500) | (3,500) |
| Goods available for sale – Excluding beginning inventory | 482,460 | 731,000 |
| Goods available for sale – Including beginning inventory | 572,460 | 881,000 |
| Less: Normal spoilage | 0 | (5,000) |
| Net sales | (664,000) | |
| Employees discounts | (6,000) | |
| Estimated ending inventory at current year retail prices | 206,000 | |
| Estimated ending inventory at cost (Refer Table 2) | (123,990) | |
| Estimated Cost of Goods Sold | 448,470 |
Table (1)
Working Notes:
Calculate base layer cost-to retail percentage.
Calculate current year cost-to retail percentage.
Calculate the amount of estimated ending inventory at cost.
| Ending inventory at dollar-value LIFO retail cost | ||||
| Ending inventory at year-end retail prices ($) | Ending inventory at base year retail prices ($) | Inventory layers at base year retail prices ($) | Inventory layers converted to cost ($) | |
| 206,000 | 200,000 | 150,000 (Base) | 90,000 | |
| 50,000 (2018) | 33,990 | |||
| Total ending inventory at dollar-value LIFO retail cost | 123,990 | |||
Table (2)
Calculate the amount of ending inventory at base year retail prices.
Calculate the amount of inventory layers at base year retail prices.
Calculate the amount of inventory layers at current year retail prices.
Calculate the amount of inventory layers converted to cost (Base).
Calculate the amount of inventory layers converted to cost (2018).
Calculate the amount of estimated ending inventory and cost of goods sold at retail.
| Details | Cost ($) | Retail ($) |
| Beginning inventory | 123,990 | 206,000 |
| Add: Net purchase | 511,000 | 760,000 |
| Freight-in | 8,000 | |
| Net markups | 10,000 | |
| Less: Net markdowns | (6,000) | |
| Purchase returns | (2,200) | (4,000) |
| Goods available for sale – Excluding beginning inventory | 516,800 | 760,000 |
| Goods available for sale – Including beginning inventory | 640,790 | 966,000 |
| Less: Normal spoilage | 0 | (6,600) |
| Net sales | (697,500) | |
| Employees discounts | (7,500) | |
| Estimated ending inventory at current year retail prices | 254,400 | |
| Estimated ending inventory at cost (Refer Table 4) | (152,822) | |
| Estimated Cost of Goods Sold | 487,968 |
Table (3)
Working Notes:
Calculate base layer cost-to retail percentage.
Calculate 2018 year cost-to retail percentage.
Calculate current year cost-to retail percentage.
Calculate the amount of estimated ending inventory at cost.
| Ending inventory at dollar-value LIFO retail cost | ||||
| Ending inventory at year-end retail prices ($) | Ending inventory at base year retail prices ($) | Inventory layers at base year retail prices ($) | Inventory layers converted to cost ($) | |
| 254,400 | 240,000 | 150,000 (Base) | 90,000 | |
| 50,000 (2018) | 33,990 | |||
| 40,000 (2019) | 28,832 | |||
| Total ending inventory at dollar-value LIFO retail cost | 152,822 | |||
Table (4)
Calculate the amount of ending inventory at base year retail prices.
Calculate the amount of inventory layers at base year retail prices.
Calculate the amount of inventory layers at current year retail prices.
Calculate the amount of inventory layers converted to cost (Base).
Calculate the amount of inventory layers converted to cost (2018).
Calculate the amount of inventory layers converted to cost (2019).
2.
Average cost
It is amethod of determining the cost-to retail percentage for all the goods available for sale.
To Calculate: The amount of ending inventory and cost of goods sold.
Explanation of Solution
The following table shows the ending inventory and cost of goods sold.
| Details | Cost ($) | Retail ($) |
| Beginning inventory | 90,000 | 150,000 |
| Add: Net purchase | 478,000 | 730,000 |
| Freight-in | 6,960 | |
| Net markups | 8,500 | |
| Less: Purchase Returns | (2,500) | (3,500) |
| Net markdowns | (4,000) | |
| Goods available for sale | 572,460 | 881,000 |
| Less: Normal spoilage | (5,000) | |
| Net sales | (664,000) | |
| Employees discounts | (6,000) | |
| Estimated ending inventory at retail | 206,000 | |
| Estimated ending inventory at cost(1) | (133,859) | |
| Estimated Cost of Goods Sold | 438,601 |
Table (5)
Working Note:
Calculate cost-to-retail percentage.
Calculate the amount of estimated ending inventory at cost.
3.
Conventional Retail Method
Conventional retail method refers to the estimation of the lower of average cost or market by eliminating the markdowns from the calculation of the cost-to-retail percentage.
In this case, the cost-to-retail percentage will be determined by dividing the goods available for sale at cost by the goods available for at retail (excluding markdowns). Thus, the conventional retail method will always result in lower estimation of ending inventory when the markdowns exist.
To Calculate: The amount of ending inventory and cost of goods sold.
Explanation of Solution
The following table shows the ending inventory and cost of goods sold.
| Details | Cost ($) | Retail ($) |
| Beginning inventory | 90,000 | 150,000 |
| Add: Net purchase | 478,000 | 730,000 |
| Freight-in | 6,960 | |
| Net markups | 8,500 | |
| Less: Purchase Returns | (2,500) | (3,500) |
| Net markdowns | (4,000) | |
| Goods available for sale | 572,460 | 881,000 |
| Less: Normal spoilage | (5,000) | |
| Net sales | (664,000) | |
| Employees discounts | (6,000) | |
| Estimated ending inventory at retail | 206,000 | |
| Estimated ending inventory at cost(2) | (133,241) | |
| Estimated Cost of Goods Sold | 439,219 |
Table (6)
Working Note:
Calculate cost-to-retail percentage.
Calculate the amount of estimated ending inventory at cost.
Want to see more full solutions like this?
Chapter 9 Solutions
Intermediate Accounting


 Cornerstones of Financial AccountingAccountingISBN:9781337690881Author:Jay Rich, Jeff JonesPublisher:Cengage Learning