
(a)
Interpretation:
Refer to the given phase diagram of compound X. The physical state of compound X is to be determined at pressure 35mmHg and temperature -50°C.
Concept introduction:
Phase diagram can be defined as the representation of pressure and temperature quantities of any pure substance. At these values of temperature and pressure, the different phases of the pure substance are equilibrium to each other.
Answer to Problem 17QAP
The physical state of compound X is solid determined at pressure 35mmHg and temperature -50°C.
Explanation of Solution
Given Information:
The phase diagram of compound X is as follows:
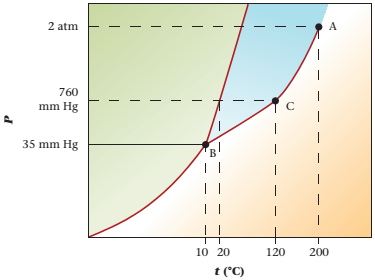
The triple point is defined as the equilibrium condition among all the three phases of any pure substance which is solid, liquid and gas. The curves are used for the equilibrium condition between two phases of pure substance. The phase diagram is shown below-
In the below diagram −
a = solid-liquid phase in equilibrium
b = liquid-vapor phase in equilibrium
c = solid-vapor phase in equilibrium

Given values-
Pressure = 35mmHg
Temperature = -50°C
These two given values are represented in the plot of the phase diagram of compound X. These two quantities are existing at the left of point B.
Hence,
At pressure 35 mmHg and at temperature -50°C, the physical state of the compound is solid.
(b)
Interpretation:
The normal boiling point of a compound is to be determined.
Concept introduction:
Phase diagram can be defined as the representation of pressure and temperature quantities of any pure substance. At these values of temperature and pressure, the different phases of the pure substance are equilibrium to each other.
Answer to Problem 17QAP
The normal boiling point of a compound is 120°C.
Explanation of Solution
The triple point is defined as the equilibrium condition among all the three phases of any pure substance which is solid, liquid and gas. The curves are used for the equilibrium condition between two phases of pure substance. The phase diagram is shown below-

In the above diagram −
a = solid-liquid phase in equilibrium
b = liquid-vapor phase in equilibrium
c = solid-vapor phase in equilibrium
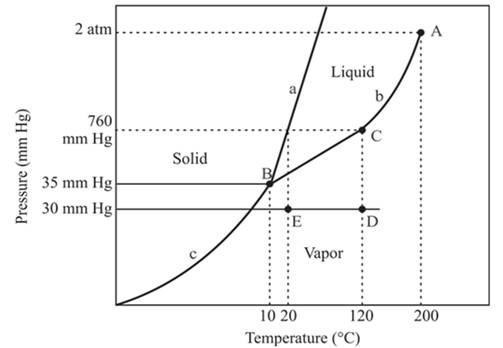
The normal boiling temperature is the temperature at which compound start boiling which is basically atmospheric pressure. Therefore pressure for the boiling point is 760mmHg. At atmospheric pressure of boiling point, if at the particular temperature the liquid and vapor phase of a substance are at equilibrium, then that temperature is the boiling point temperature. From the phase diagram of substance at temperature, 120°C liquid and vapor phase of a substance is at the equilibrium.
Hence, the boiling point temperature is 120°C.
(c)
Interpretation:
The critical point for the compound is to be located.
Concept introduction:
Phase diagram can be defined as the representation of pressure and temperature quantities of any pure substance. At these values of temperature and pressure, the different phases of the pure substance are equilibrium to each other.
Answer to Problem 17QAP
The critical point for the compound is located at point A.
Explanation of Solution
The triple point is defined as the equilibrium condition among all the three phases of any pure substance which is solid, liquid and gas. The curves are used for the equilibrium condition between two phases of water. The phase diagram is shown below-

In the above diagram −
a = solid-liquid phase in equilibrium
b = liquid-vapor phase in equilibrium
c = solid-vapor phase in equilibrium
From the above diagram, the critical point of a substance is represented by the end of that curve which shows the equilibrium condition between the liquid phase and vapor phase. This curve is curved b and it ends at point A at temperature 200°C and at pressure 2 atm.
Hence, the critical point will exist at point A.
(d)
Interpretation:
The triple point for the compound is to be located.
Concept introduction:
Phase diagram can be defined as the representation of pressure and temperature quantities of any pure substance. At these values of temperature and pressure, the different phases of the pure substance are equilibrium to each other.
Answer to Problem 17QAP
The triple point for the compound is located at point B
Explanation of Solution
The triple point is defined as the equilibrium condition among all the three phases of any pure substance which is solid, liquid and gas. The curves are used for the equilibrium condition between two phases of water. The phase diagram is shown below-

In the above diagram −
a = solid-liquid phase in equilibrium
b = liquid-vapor phase in equilibrium
c = solid-vapor phase in equilibrium
The triple point represents the equilibrium among all the phases which are solid, liquid and gas of compound. Hence, the intersection point of all curves a, b and c will represent the triple point. From the graph, the intersection point of these three curves is existing at point B.
Therefore, point B will represent the triple point of the compound.
(e)
Interpretation:
The changes are to be determined at constant pressure 30mmHg and the temperature is changing from 120°C to 20°C.
Concept introduction:
Phase diagram can be defined as the representation of pressure and temperature quantities of any pure substance. At these values of temperature and pressure, the different phases of the pure substance are equilibrium to each other.
Answer to Problem 17QAP
At constant pressure, 30mmHg and the process of changing of temperature from 120°C to 20°C is occurring between point D and E. In this process-
No change in phase.
The density of the vapor phase is high at point E in comparison to point D.
Explanation of Solution
The triple point is defined as the equilibrium condition among all the three phases of any pure substance which is solid, liquid and gas. The curves are used for the equilibrium condition between two phases of water. The phase diagram is shown below-

In the above diagram −
a = solid-liquid phase in equilibrium
b = liquid-vapor phase in equilibrium
c = solid-vapor phase in equilibrium
In this process the, the pressure is constant and the temperature varies from 120°C to 20°C which is represented by point D and E. the starting point D and end point E both are existing in the vapor phase. It means there is no phase change when the temperature is decreasing form 120°C to 20°C. The density of the vapor phase at point E will be increased because it is nearer to the liquid and the solid phase in comparison to point D.
(f)
Interpretation:
The densest phase is to be determined.
Concept introduction:
Phase diagram can be defined as the representation of pressure and temperature quantities of any pure substance. At these values of temperature and pressure, the different phases of the pure substance are equilibrium to each other.
Answer to Problem 17QAP
The densest phase is a solid phase.
Explanation of Solution
The triple point is defined as the equilibrium condition among all the three phases of any pure substance which is solid, liquid and gas. The curves are used for the equilibrium condition between two phases of water. The phase diagram is shown below-
In the above diagram −
a = solid-liquid phase in equilibrium
b = liquid-vapor phase in equilibrium
c = solid-vapor phase in equilibrium
The densest part of this phase diagram is a solid phase because in solid phase all molecules are closely bound and from the diagram, we can see that the solid phase exists at the high temperature and low pressure, therefore, solid phase is the densest phase among all.
Want to see more full solutions like this?
Chapter 9 Solutions
Chemistry: Principles and Reactions

- Please help, this is all the calculations i got!!! I will rate!!!Approx mass of KMnO in vial: 3.464 4 Moss of beaker 3×~0. z Nax200: = 29.9219 Massof weacerv after remosimgain N2C2O4. Need to fill in all the missing blanks. ง ง Approx mass of KMnO4 in vials 3.464 Mass of beaker + 3x ~0-304: 29.9219 2~0.20 Miss of beaker + 2x- 29.7239 Mass of beaker + 1x~0.2g Naz (204 29-5249 Mass of beaver after removing as qa Na₂ C₂O T1 T2 T3 Final Buiet reading Initial butet reading (int)) Hass of NaOr used for Titration -reading (mL) calculation Results: 8.5ml 17mL 27.4mL Oml Om Oml T1 T2 T3 Moles of No CO Moles of KMO used LOF KM. O used Molenty of KMNO Averagem Of KMOWLarrow_forwardDraw the skeletal ("line") structure of 2-hydroxy-4-methylpentanal. Click and drag to start drawing a structure. Xarrow_forwardDetermine whether the following molecule is a hemiacetal, acetal, or neither and select the appropriate box below. Also, highlight the hemiacetal or acetal carbon if there is one. hemiacetal acetal Oneither OHarrow_forward
- What is the missing reactant R in this organic reaction? ་ ་ ་ ་ ་ ་ ་ ་ ་ ་ +R H3O+ • Draw the structure of R in the drawing area below. N • Be sure to use wedge and dash bonds if it's necessary to draw one particular enantiomer. Click and drag to start drawing a structure.arrow_forwardWrite the systematic name of each organic molecule: H structure H OH OH H OH name ☐ OHarrow_forwardDetermine whether each of the following molecules is a hemiacetal, acetal, or neither and select the appropriate box in the table. CH3O OH OH OH hemiacetal acetal neither hemiacetal acetal neither Xarrow_forward
- What is the missing reactant R in this organic reaction? N N དལ་ད་་ + R • Draw the structure of R in the drawing area below. • Be sure to use wedge and dash bonds if it's necessary to draw one particular enantiomer. Click and drag to start drawing a structure. ㄖˋarrow_forwardDraw the condensed structure of 4-hydroxy-3-methylbutanal. Click anywhere to draw the first atom of your structure.arrow_forwardUsing the bond energy values, calculate the energy that must be supplied or is released upon the polymerization of 755 monomers. If energy must be supplied, provide a positive number; if energy is released, provide a negative number. Hint: Avogadro’s number is 6.02 × 1023.arrow_forward
- -AG|F=2E|V 3. Before proceeding with this problem you may want to glance at p. 466 of your textbook where various oxo-phosphorus derivatives and their oxidation states are summarized. Shown below are Latimer diagrams for phosphorus at pH values at 0 and 14: Acidic solution -0.93 +0.38 -0.51 -0.06 H3PO4 →H4P206 H3PO3 H3PO2 → P→ PH3 -0.28 -0.50 → -0.50 Basic solution 3-1.12 -1.57 -2.05 -0.89 PO HPO →→H2PO2 P PH3 -1.73 a) Under acidic conditions, H3PO4 can be reduced into H3PO3 directly (-0.28V), or via the formation and reduction of H4P2O6 (-0.93/+0.38V). Calculate the values of AG's for both processes; comment. (3 points) 0.5 PH, 0.0 -0.5- 2 3 9 3 -1.5 -2.0 Pa H,PO H,PO H,PO -3 -1 0 2 4 Oxidation state, N 2 b) Frost diagram for phosphorus under acidic conditions is shown. Identify possible disproportionation and comproportionation processes; write out chemical equations describing them. (2 points) c) Elemental phosphorus tends to disproportionate under basic conditions. Use data in…arrow_forwardThese two reactions appear to start with the same starting materials but result in different products. How do the chemicals know which product to form? Are both products formed, or is there some information missing that will direct them a particular way?arrow_forwardWhat would be the best choices for the missing reagents 1 and 3 in this synthesis? 1. PPh3 3 1 2 2. n-BuLi • Draw the missing reagents in the drawing area below. You can draw them in any arrangement you like. • Do not draw the missing reagent 2. If you draw 1 correctly, we'll know what it is. • Note: if one of your reagents needs to contain a halogen, use bromine. Explanation Check Click and drag to start drawing a structure. 2025 McGraw Hill LLC. All Rights Reserved. Terms of Use | Priva ×arrow_forward
 Chemistry: Principles and ReactionsChemistryISBN:9781305079373Author:William L. Masterton, Cecile N. HurleyPublisher:Cengage Learning
 Principles of Modern ChemistryChemistryISBN:9781305079113Author:David W. Oxtoby, H. Pat Gillis, Laurie J. ButlerPublisher:Cengage Learning
 World of Chemistry, 3rd editionChemistryISBN:9781133109655Author:Steven S. Zumdahl, Susan L. Zumdahl, Donald J. DeCostePublisher:Brooks / Cole / Cengage Learning
 Chemistry: The Molecular ScienceChemistryISBN:9781285199047Author:John W. Moore, Conrad L. StanitskiPublisher:Cengage Learning
 Chemistry: Principles and PracticeChemistryISBN:9780534420123Author:Daniel L. Reger, Scott R. Goode, David W. Ball, Edward MercerPublisher:Cengage Learning
 General Chemistry - Standalone book (MindTap Cour...ChemistryISBN:9781305580343Author:Steven D. Gammon, Ebbing, Darrell Ebbing, Steven D., Darrell; Gammon, Darrell Ebbing; Steven D. Gammon, Darrell D.; Gammon, Ebbing; Steven D. Gammon; DarrellPublisher:Cengage Learning