
Concept explainers
Videos
(a)
Sketch a
| Year | Equipment sales ($ millions) | |
| Baseball and softball | Tennis | |
(a)
Answer to Problem 3PPS
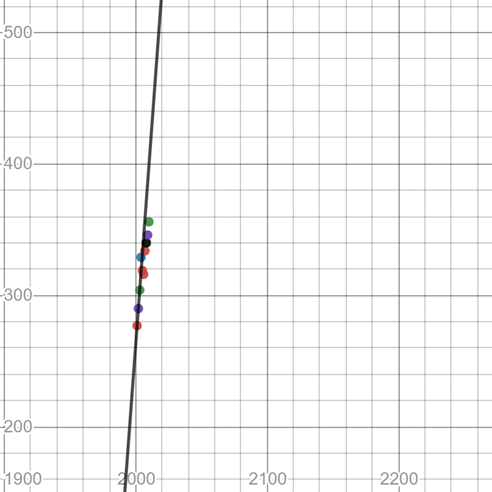
The scatter plot and the line of fits are shown by the following graph:
Explanation of Solution
Given:
| Year | Equipment sales ($ millions) | |
| Baseball and softball | Tennis | |
Concept Used:
The slope intercept form equation is
Where;
Slope:
Y-intercept:
Calculation:
Consider,
Year:
Baseball and softball:
There are ten points are given as:
Now use any two points to calculate the slope intercept from equation:
Now, the slope intercept form equation is written as:
Now put the value of
So, the final slope intercept form equation is:
The scatter plot and the line of fits are shown by the following graph by using the above data points and line of fit eq. or slope-intercept form eq.
Conclusion:
Hence, with the help of slope-intercept form the line of fit is drawn as above.
(b)
The number of sales of in
(b)
Answer to Problem 3PPS
The sales of football and soft ball for
Explanation of Solution
Given:
Concept Used:
The slope intercept form equation is
Where;
Slope:
Y-intercept:
Calculation:
From the first subpart:
The final slope intercept form equation is derived as:
Now, to calculate the number of sales softball and basketball
Conclusion:
Hence, sales of baseball and softball ball for
(c)
Sketch a scatter plot for the tennis sales with the line of fit.
| Year | Equipment sales ($ millions) | |
| Baseball and softball | Tennis | |
(c)
Answer to Problem 3PPS
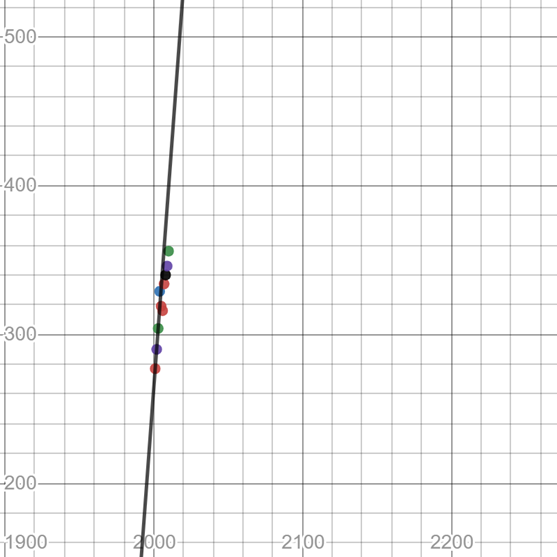
The scatter plot and the line of fits are shown by the following graph:

Explanation of Solution
Given:
| Year | Equipment sales ($ millions) | |
| Baseball and softball | Tennis | |
Concept Used:
The slope intercept form equation is
Where;
Slope:
Y-intercept:
Calculation:
Consider,
Year:
Tennis:
There are ten points are given as:
Now use any two points to calculate the slope intercept from equation:
Now, the slope intercept form equation is written as:
Now put the value of
So, the final slope intercept form equation is:
The scatter plot and the line of fits are shown by the following graph by using the above data points and line of fit eq. or slope-intercept form eq.
Conclusion:
Hence, with the help of slope-intercept form the line of fit is drawn as above.
(d)
The number of sales of tennis in the year
(d)
Answer to Problem 3PPS
The sales of tennis for
Explanation of Solution
Given:
Concept Used:
The slope intercept form equation is
Where;
Slope:
Y-intercept:
Calculation:
From the first subpart:
The final slope intercept form equation is derived as:
Now, to calculate the number of Sunday newspapers
Conclusion:
Hence, sales of tennis for
Chapter 8 Solutions
Pre-Algebra Student Edition
Additional Math Textbook Solutions
Introductory Statistics
Intro Stats, Books a la Carte Edition (5th Edition)
Elementary Statistics: Picturing the World (7th Edition)
Elementary Statistics (13th Edition)
Thinking Mathematically (6th Edition)
Algebra and Trigonometry (6th Edition)


- Safari File Edit View History Bookmarks Window Help Ο Ω OV O mA 0 mW ర Fri Apr 4 1 222 tv A F9 F10 DII 4 F6 F7 F8 7 29 8 00 W E R T Y U S D பட 9 O G H J K E F11 + 11 F12 O P } [arrow_forwardSo confused. Step by step instructions pleasearrow_forwardIn simplest terms, Sketch the graph of the parabola. Then, determine its equation. opens downward, vertex is (- 4, 7), passes through point (0, - 39)arrow_forward
- In simplest way, For each quadratic relation, find the zeros and the maximum or minimum. a) y = x 2 + 16 x + 39 b) y = 5 x2 - 50 x - 120arrow_forwardIn simplest terms and step by step Write each quadratic relation in standard form, then fi nd the zeros. y = - 4( x + 6)2 + 36arrow_forwardIn simplest terms and step by step For each quadratic relation, find the zeros and the maximum or minimum. 1) y = - 2 x2 - 28 x + 64 2) y = 6 x2 + 36 x - 42arrow_forward
- Write each relation in standard form a)y = 5(x + 10)2 + 7 b)y = 9(x - 8)2 - 4arrow_forwardIn simplest form and step by step Write the quadratic relation in standard form, then fi nd the zeros. y = 3(x - 1)2 - 147arrow_forwardStep by step instructions The path of a soccer ball can be modelled by the relation h = - 0.1 d 2 + 0.5 d + 0.6, where h is the ball’s height and d is the horizontal distance from the kicker. a) Find the zeros of the relation.arrow_forward
 Algebra and Trigonometry (6th Edition)AlgebraISBN:9780134463216Author:Robert F. BlitzerPublisher:PEARSON
 Contemporary Abstract AlgebraAlgebraISBN:9781305657960Author:Joseph GallianPublisher:Cengage Learning
 Linear Algebra: A Modern IntroductionAlgebraISBN:9781285463247Author:David PoolePublisher:Cengage Learning
 Algebra And Trigonometry (11th Edition)AlgebraISBN:9780135163078Author:Michael SullivanPublisher:PEARSON
 Introduction to Linear Algebra, Fifth EditionAlgebraISBN:9780980232776Author:Gilbert StrangPublisher:Wellesley-Cambridge Press
 College Algebra (Collegiate Math)AlgebraISBN:9780077836344Author:Julie Miller, Donna GerkenPublisher:McGraw-Hill Education