
Concept explainers
Videos
(a)
To calculate: To find what value was added to each term of the sequence
(a)
Answer to Problem 39HP
Explanation of Solution
Given information: Sequence is
Formula Used:
Sequence is an arithmetic sequence when the difference between the two terms is constant.
Nth term in arithmetic sequence is given as
Where,
Calculation:
Sequence is given as follows:
Let us find the difference between each term
Thus,
Conclusion:
Hence,
(b)
To calculate: To find and explain if the set of ordered pairs (term number, term) is a function
(b)
Answer to Problem 39HP
The set of ordered pair (term number, term) is a function
Explanation of Solution
Given information: Sequence is
Formula Used:
According to function rule, no input can have more than one output.
The set ordered pairs is referred to as function when no two ordered pairs have the same first coordinate with different second coordinate
Calculation:
Table is completed as follows:
| Term Number | Term |
| 1 | 36 |
| 2 | 33 |
| 3 | 30 |
| 4 | 27 |
| 5 | 24 |
| 6 | 21 |
| 7 | 18 |
From above table, Set of ordered pairs (term number, term) is
Here, no two ordered pairs have same first coordinate.
Thus, the set of ordered pairs is a function
Conclusion:
Hence, the set of ordered pairs is a function
(c)
To calculate: To graph the set of ordered pairs
(c)
Answer to Problem 39HP
The set of ordered pair (term number, term) is a function
Explanation of Solution
Given information: Sequence is
Formula Used:
According to function rule, no input can have more than one output.
The set ordered pairs is referred to as function when no two ordered pairs have the same first coordinate with different second coordinate
Calculation:
Table is completed as follows:
| Term Number | Term |
| 1 | 36 |
| 2 | 33 |
| 3 | 30 |
| 4 | 27 |
| 5 | 24 |
| 6 | 21 |
| 7 | 18 |
From above table, Set of ordered pairs (term number, term) is
Plotting the points in graph,
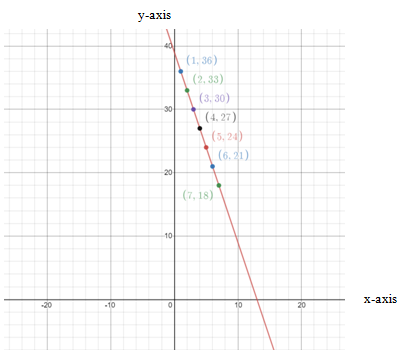
With every increase in term number, term is decreasing by
Conclusion:
Hence, the graph is sketched
Chapter 8 Solutions
Pre-Algebra Student Edition
Additional Math Textbook Solutions
Elementary Statistics
Introductory Statistics
A First Course in Probability (10th Edition)
College Algebra (7th Edition)
Elementary Statistics: Picturing the World (7th Edition)
Calculus: Early Transcendentals (2nd Edition)


- Consider the table of values below. x y 2 64 3 48 4 36 5 27 Fill in the right side of the equation y= with an expression that makes each ordered pari (x,y) in the table a solution to the equation.arrow_forwardsolving for xarrow_forwardConsider the table of values below. x y 2 63 3 70 4 77 5 84 Fill in the right side of the equation y= with an expression that makes each ordered pari (x,y) in the table a solution to the equation.arrow_forward
- There were 426 books sold in one week. The number of biology books sold was 5 times that of the number of psychology books. How many books each were sold?arrow_forwardPopulation decreases 5% each year. Starts with a starting population of 3705. Find that population after 5 years.arrow_forwardsolve using substitution -2x-3y=-15 -3x+9y=12arrow_forward
- Suppose that 7000 is placed in an accout that pays 4% interest. Interest compunds each year. Assume that no withdraws are made. How much would the account have after 1 year? And how much would the account have after 2 years?arrow_forwardUse substitution to solve the equations -2x+5y=18 x=2y-8arrow_forward5) For each function represented by an equation, make a table and plot the corresponding points to sketch the graph of the function. (a) y = 75 ()* 220 X y 200- -2 180 160 -1 140 0 120 100 1 60 80 2 3 4 x (b) y = 20 ()* 1 60 40 20 20 0 2 3 65- -1 X y 60 -2 55- 50 45 44 40 0 35- 30 1 25 2 20 20 15 3 10 5 LO 4 3-2 T -1 0 5- 4- -3- 2-arrow_forward
- A system of inequalities is shown. y 5 3 2 1 X -5 -4 -3 -2 -1 0 1 2 3 4 5 -1- Which system is represented in the graph? Oy>-x²-x+1 y 2x²+3 -2 -3 тarrow_forwardWhich set of systems of equations represents the solution to the graph? -5 -4 -3 -2 Of(x) = x² + 2x + 1 g(x) = x²+1 f(x) = x²+2x+1 g(x) = x²-1 f(x) = −x² + 2x + 1 g(x) = x²+1 f(x) = x² + 2x + 1 g(x) = x²-1 -1 5 y 4 3 2 1 0 -1- -2 -3- -4. -5 1 2 3 4 5arrow_forwardWhich of the graphs below correctly solves for x in the equation -x² - 3x-1=-x-4? о 10 8 (0,2) -10 -8 -6 -2 2 4 6 8 10 (-4,-2) -2 + (0,2) (4,6) -10-8-6-4-2 -2 2 4 6 8 10 (-3, -1) -2 2 (1-5) -6 -8 -10 10 -10-8-6-4-2 2 6 8 10 (2,0)arrow_forward
 Algebra and Trigonometry (6th Edition)AlgebraISBN:9780134463216Author:Robert F. BlitzerPublisher:PEARSON
 Contemporary Abstract AlgebraAlgebraISBN:9781305657960Author:Joseph GallianPublisher:Cengage Learning
 Linear Algebra: A Modern IntroductionAlgebraISBN:9781285463247Author:David PoolePublisher:Cengage Learning
 Algebra And Trigonometry (11th Edition)AlgebraISBN:9780135163078Author:Michael SullivanPublisher:PEARSON
 Introduction to Linear Algebra, Fifth EditionAlgebraISBN:9780980232776Author:Gilbert StrangPublisher:Wellesley-Cambridge Press
 College Algebra (Collegiate Math)AlgebraISBN:9780077836344Author:Julie Miller, Donna GerkenPublisher:McGraw-Hill Education