Videos
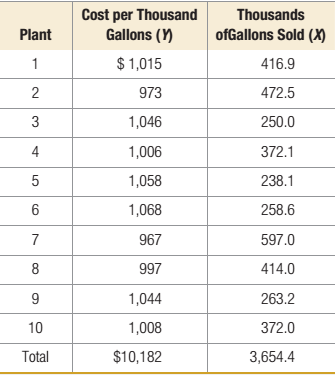
Ohio Swiss Milk Products manufactures and distribution ice cream in Ohio, Kentucky, and West Virginia. The company wants to expand operations by locating another plant in northern Ohio. The size of the new plant will be a function of the expected demand for ice cream within the area served by the plant. A market survey is currently under way to determine that demand.
Ohio Swiss wants to estimate the relationship between the
- Develop a regression equation to
forecast the cost per gallon as a function of time number of gallons produced. - What are the correlation coefficient and the coefficient of determination? Comment on your regression equation in light of these measures.
- Suppose that the market survey indicates a demand of 325,000 gallons in the Bucyrus, Ohio area.
- Estimate the manufacturing cost per gallon for a plant producing 325,000 gallons per year.
Want to see the full answer?
Check out a sample textbook solution
Chapter 8 Solutions
Operations Management: Processes and Supply Chains (11th Edition)
Additional Business Textbook Solutions
Gitman: Principl Manageri Finance_15 (15th Edition) (What's New in Finance)
Horngren's Financial & Managerial Accounting, The Financial Chapters (Book & Access Card)
Macroeconomics
Financial Accounting, Student Value Edition (5th Edition)
Horngren's Accounting (12th Edition)
Principles of Operations Management: Sustainability and Supply Chain Management (10th Edition)


- Help answer showing level work and formulasarrow_forwardI need to forecast using a 3-Period-Moving-Average-Monthly forecasting model which I did but then I need to use my forecast numbers to generate a Master Production Schedule (MPS) I have to Start with actual sales (my own test data numbers) for August-2022 Oct-2022 i need to create MPS to supply demand starting November-2022 April 2023 I just added numbers without applying formulas to the mps on the right side of the spreadsheet because I do not know how to do it. The second image is the example of what it should look like. Thank You.arrow_forwardSolve the following Question 1. How do volume and variety affect the process selection and layout types? Discuss 2. How is the human resource aspect important to operation function? Discuss 3. Discuss the supply network design and its impact on the overall performance of the organization.arrow_forward
- The supply chain is a conventional notion, but organizations are only really interested in making products that they can sell to customers. Provided they have reliable supplies of materials and reasonable transport for finished products, logistics is irrelevant. Do you think this is true? If yes, explain, and if no, clearly explain as well.arrow_forwardworking as a program operations managerarrow_forward12 X1, X230 1 x =0x2 write the Following linear Programming model by 1- general Form Canonical Forms Canonical formY 2- Standard Form Max Z=35X+ 4 X 2 +6 X3 ST. X+2X2-5x3 = 40 3X, + 6X2 + 7x 3 = 30 7x, +lox2 x3 = 50 X3 X 2 X 3 <0arrow_forward
- a/ a Minimum cost assign each worker for one job at Jobs J1 12 33 WI 2 4 6 W2 5 W3 5 33 6 7arrow_forwardوبة واضافة هذه القيمة الى القيم Ex: Assign each job for each worker at minimum total Cost عمل لكل عامل وبأقل كلفة ممكنة obs الأعمال Workors العمال J1 J2 J3 J4 W₁ 15 13 14 12 W2 11 12 15 13 W3 13 12 10 11 W4 15 17 14 16arrow_forwardThe average completion time (flow time) for the sequence developed using the FCFS rule = 11.75 days (round your response to two decimal places). The percentage utilization for the sequence developed using the FCFS rule = 42.55 % (enter your response as a percentage rounded to two decimal places). b) Using the SPT (shortest processing time) decision rule for sequencing the jobs, the order is (to resolve a tie, use the order in which the jobs were received): An Alabama lumberyard has four jobs on order, as shown in the following table. Today is day 205 on the yard's schedule. In what sequence would the jobs be ranked according to the decision rules on the left: Job Due Date A 212 B 209 C 208 D 210 Duration (days) 6 3 3 8 Sequence 1 Job B 2 3 4 A D The average tardiness (job lateness) for the sequence developed using the SPT rule = 5.00 days (round your response to two decimal places). The average completion time (flow time) for the sequence developed using the SPT rule = 10.25 days…arrow_forward
 Practical Management ScienceOperations ManagementISBN:9781337406659Author:WINSTON, Wayne L.Publisher:Cengage,
 Purchasing and Supply Chain ManagementOperations ManagementISBN:9781285869681Author:Robert M. Monczka, Robert B. Handfield, Larry C. Giunipero, James L. PattersonPublisher:Cengage Learning