Operations Management: Processes and Supply Chains (11th Edition)
11th Edition
ISBN: 9780133872132
Author: Lee J. Krajewski, Manoj K. Malhotra, Larry P. Ritzman
Publisher: PEARSON
expand_more
expand_more
format_list_bulleted
Concept explainers
Videos
Textbook Question
Chapter 8, Problem 1P
Demand for oil changes at Garcia’s Garage has been as follows:
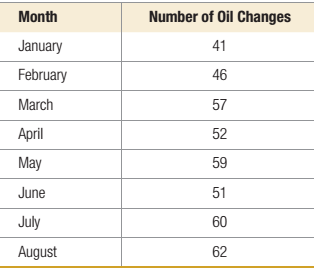
- Use simple linear regression analysis to develop a
forecasting model for monthly demand. In this application, the dependent variable, Y, is monthly demand and the independent variable, X, is the month. For January, let - Use time model to forecast demand for September, October, and November. Here,
Expert Solution & Answer
Want to see the full answer?
Check out a sample textbook solution
Students have asked these similar questions
discuss team development stages
Learning Activity 6:
Canadian Business This
Year
Read the following webpage:
The Business Development Bank of Canada.
(2023). Canadian economic outlook for 2024:
Shifting into
neutral. https://www.bdc.ca/en/articles-
tools/blog/canadian-economic-outlook-for-2024-
shifting-into-neutral
"Despite persistently high inflation and rising.
interest rates, the news was generally better than
expected for the Canadian economy in 2023" (BDC
Blog 2024).
Discussion Question:
In your view, what are the most pressing problems
for Canadian companies or consumers in 2024?
Explain your answer using current examples of
companies or consumer concerns.
Travelling and working internationally can lead to a life of adventure and unique career experiences. For businesses, selecting the right candidates to take on foreign assignments can propel, delay, or deny the success of the international ventures.
As an international manager, identify key competencies you would look for in choosing expatriates. What might be some of their concerns in taking on overseas assignments? What are some best practices in supporting expats during and after their assignments?
Chapter 8 Solutions
Operations Management: Processes and Supply Chains (11th Edition)
Ch. 8 - Figure 8.9 shows summer air visibility...Ch. 8 - Kay and Michael Passe publish What‘s...Ch. 8 - Demand for oil changes at Garcia’s Garage has...Ch. 8 - Prob. 2PCh. 8 - Ohio Swiss Milk Products manufactures and...Ch. 8 - A manufacturing firm has developed a skills test,...Ch. 8 - The materials handling manager of a manufacturing...Ch. 8 - Marianne Kramer, the owner of Handy Man Rentals,...Ch. 8 - Sales for the past 12 months at Computer Success...Ch. 8 - Bradley’s Copiers sells and repairs photocopy...
Ch. 8 - Consider the sales data for Computer Success given...Ch. 8 - A convenience store recently started to carry a...Ch. 8 - Community Federal Bank in Dothan, Alabama,...Ch. 8 - The number of heart surgeries performed at...Ch. 8 - The following data are for calculator sales in...Ch. 8 - Prob. 14PCh. 8 - Forrest and Dan make boxes of chocolates for which...Ch. 8 - The manager of Alaina’s Garden Center must make...Ch. 8 - The manager of a utility company in the Texas...Ch. 8 - Franklin Tooling, Inc., manufactures specialty...Ch. 8 - Create an Excel spreadsheet on your own that can...Ch. 8 - Prob. 20PCh. 8 - Using the data in Problem 20 and the Time-Series...Ch. 8 - Prob. 22PCh. 8 - Cannister, Inc., specializes in the manufacture of...Ch. 8 - The Midwest Computer Company serves a large number...Ch. 8 - A certain food item at P=0.20 (with a combination...Ch. 8 - Prob. 26PCh. 8 - Prob. 27PCh. 8 - A manufacturing firm seeks to develop a better...Ch. 8 - How much does the forecasting process at Deckers...Ch. 8 - Prob. 2VCCh. 8 - What factors make forecasting at Deckers...Ch. 8 - Prob. 4VCCh. 8 - Prob. 5VCCh. 8 - Comment on the forecasting system being used by...Ch. 8 - Develop your own forecast for bow rakes for each...
Additional Business Textbook Solutions
Find more solutions based on key concepts
Which of the following is a primary activity in the value chain?
purchasing
accounting
post-sales service
human...
Accounting Information Systems (14th Edition)
Discussion Analysis A13-41 Discussion Questions 1. How do managers use the statement of cash flows? 2. Describ...
Managerial Accounting (5th Edition)
1-1. Define marketing and outline the steps in the marketing process. (AASCB: Communication)
Marketing: An Introduction (13th Edition)
The Warm and Toasty Heating Oil Company used to deliver heating oil by sending trucks that printed out a ticket...
Essentials of MIS (13th Edition)
Fundamental and Enhancing Characteristics. Identify whether the following items are fundamental characteristics...
Intermediate Accounting (2nd Edition)
Knowledge Booster


Learn more about
Need a deep-dive on the concept behind this application? Look no further. Learn more about this topic, operations-management and related others by exploring similar questions and additional content below.Similar questions
- Research proposal: The Investigation of Career Development and Job satisfaction atEskom Rotek Industries 1. Introduction (250 words) 2. Research Context: Background (Research Context: Background (250 words) 3. The Research Problem (The Research Problem) 4. Aim of the study (Maximum 50 words) 5. Research Objectives (3 in total) 6. Research Questions (3 in total) 7. Justification or rationale of the study (150 words) 8. Literature Review (2-3 pages / 1000-1500 words) 9. Research Design and Methodology (1 - 2 page in total, from 9.1 to 9.6) 9.1 Research Philosophy 9.2 Research Methodology 9.3 Target Population and Sampling strategy 9.4 Data Collection 9.5 Data Analysis (100 words) 9.6 Pilot Study 10. Ethical considerations 11. Referencearrow_forwardWith your experience and research, discuss;(a) what type of “Leadership Style” is used in communications services (Digicel Group Limited)?(b) whether the style used is successful or not and why. Justify your position with relevant citation and references ( Rubic is attached to guide the essay ) NOTE: NO AI RESPONSES PLEASEarrow_forwardby the end of 2013, the IPL port was operational and the naphtha was flowing to the Himachal Fertilizer Corporation (HFC) plant in Central India after being granted the port contract in Summer 2012. The plant was located in an industrial area that had several pipelines in the general geographic area including a crude oil pipeline leading to a refinery, and a pipeline carrying pesticides to be processed and redistributed to local farms in the area. In July 2014, Ajay Patel, the logistics general manager received notification that there were some minor leaks along the pipeline that were being fixed. Workers in the area had experienced sudden headaches and lightheadedness and the company immediately moved to investigate the leak and address faulty seams that had eroded and weakened. The flow of naphtha was temporarily stopped for 72 hours so two portions of the pipeline could be removed, and the eroded portions replaced. Patel put enormous pressure on the repair team to get the repair…arrow_forward
- in the MABE: learning to be multinational case report, what is the reccomended course of action?arrow_forwardIn the MABE case report what would be the reccomened course of action?arrow_forwardQuestion 6. An electrical engineering company is designing two types of solar panel systems: Standard Panels (S) and High-Efficiency Panels (H). The company has certain constraints regarding the hours of labor and material available for production each week. Each Standard Panel requires 4 hours of labor and 2 units of material and each High-Efficiency Panel requires 3 hours of labor and 5 units of material. The company has a maximum of 60 hours of labor and 40 units of material available per week. The profit from each Standard Panel is GH¢80, and the profit from each High-Efficiency Panel is GH¢100. The company wants to determine how many of each type of panel to produce in order to maximize profit. i) Solve this LPP by using graphical analysis ii) What will be the slack at the optimal solution point? Show calculation.arrow_forward
- qusestion 6. An electrical engineering company is designing two types of solar panel systems: Standard Panels (S) and High-Efficiency Panels (H). The company has certain constraints regarding the hours of labor and material available for production each week. Each Standard Panel requires 4 hours of labor and 2 units of material and each High-Efficiency Panel requires 3 hours of labor and 5 units of material. The company has a maximum of 60 hours of labor and 40 units of material available per week. The profit from each Standard Panel is GH¢80, and the profit from each High-Efficiency Panel is GH¢100. The company wants to determine how many of each type of panel to produce in order to maximize profit. i. Formulate a linear programming model of the problem for the company. ii Convert the linear programming model formulated in (a) to a standard form.arrow_forwardG ווח >>> Mind Tap Cengage Learning 1- CENGAGE MINDTAP Chapter 09 Excel Activity: Exponential Smoothing Question 1 3.33/10 e Submit 自 A ng.cengage.com C Excel Online Student Work G A retail store records customer demand during each sales period. 1. What is the f... Q Search this course ? ✓ Co Excel Online Tutorial Excel Online Activity: Exponential Smoothing A-Z A retail store records customer demand during each sales period. The data has been collected in the Microsoft Excel Online file below. Use the Microsoft Excel Online file below to develop the single exponential smoothing forecast and answer the following questions. Office Video X Open spreadsheet Questions 1. What is the forecast for the 13th period based on the single exponential smoothing? Round your answer to two decimal places. 25.10 2. What is the MSE for the single exponential smoothing forecast? Round your answer to two decimal places. 21.88 Activity Frame ? 3. Choose the correct graph for the single exponential…arrow_forwardNot use ai pleasearrow_forward
- Items removed from the work area (5S) were taken to a storage area called ___________. Choose from: SORT, STORD, KNUJ, STUFF, FUDG SORT STORD KNUJ STUFF FUDGarrow_forwardCould you please help explain How was the poor strategic decisions lead to economic downturns of Circuit City Company? What are the sequences of key events and problems that contribute to its collapse. Could you please explain each one them and give the examples If Circuit City would apply Lean Six Sigma. would it helped prevent businesses from collapsed?? How Qualitative and quantitative Research Methodology in Case Study Research would affect Circuit City?arrow_forwardApple is a global technology company renowned for its innovation and design. To create its products, Apple has established a world class global supply chain to bring their products to market. What strategies is Apple using to source and manufacture its products? How does Apple view its responsibility to its suppliers and those who build its products?arrow_forward
arrow_back_ios
SEE MORE QUESTIONS
arrow_forward_ios
Recommended textbooks for you
 Contemporary MarketingMarketingISBN:9780357033777Author:Louis E. Boone, David L. KurtzPublisher:Cengage Learning
 Practical Management ScienceOperations ManagementISBN:9781337406659Author:WINSTON, Wayne L.Publisher:Cengage,
 MarketingMarketingISBN:9780357033791Author:Pride, William MPublisher:South Western Educational Publishing
 Purchasing and Supply Chain ManagementOperations ManagementISBN:9781285869681Author:Robert M. Monczka, Robert B. Handfield, Larry C. Giunipero, James L. PattersonPublisher:Cengage Learning
Contemporary Marketing
Marketing
ISBN:9780357033777
Author:Louis E. Boone, David L. Kurtz
Publisher:Cengage Learning
Practical Management Science
Operations Management
ISBN:9781337406659
Author:WINSTON, Wayne L.
Publisher:Cengage,
Marketing
Marketing
ISBN:9780357033791
Author:Pride, William M
Publisher:South Western Educational Publishing
Purchasing and Supply Chain Management
Operations Management
ISBN:9781285869681
Author:Robert M. Monczka, Robert B. Handfield, Larry C. Giunipero, James L. Patterson
Publisher:Cengage Learning
Single Exponential Smoothing & Weighted Moving Average Time Series Forecasting; Author: Matt Macarty;https://www.youtube.com/watch?v=IjETktmL4Kg;License: Standard YouTube License, CC-BY
Introduction to Forecasting - with Examples; Author: Dr. Bharatendra Rai;https://www.youtube.com/watch?v=98K7AG32qv8;License: Standard Youtube License