Operations Management: Processes and Supply Chains (11th Edition)
11th Edition
ISBN: 9780133872132
Author: Lee J. Krajewski, Manoj K. Malhotra, Larry P. Ritzman
Publisher: PEARSON
expand_more
expand_more
format_list_bulleted
Concept explainers
Videos
Textbook Question
Chapter 8, Problem 23P
Cannister, Inc., specializes in the manufacture of plastic containers. The data on the monthly sales of 10-ounce shampoo bottles for the past 5 years are as follows:
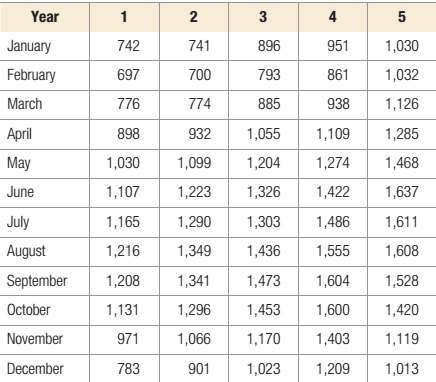
- Using the multiplicative seasonal method, calculate the monthly seasonal indices.
- Develop a simple linear regression equation to
forecast annual sales. For this regression, the dependent variable, Y, is the demand in each year and the independent variable, X, is the index for the year (i.e., - Forecast the annual sales for year G by using the regression model you developed in part (b).
- Prepare the seasonal forecast for each month by using the monthly seasonal indices calculated in part (a).
Expert Solution & Answer
Want to see the full answer?
Check out a sample textbook solution
Students have asked these similar questions
“Implementing a Performance Management Communication Plan at Accounting, Inc.”
Evaluate Accounting Inc.’s communication plan. Specifically, does it answer all of the questions that a good communication plan should answer? Which questions are left unanswered? How would you provide answers to the unanswered questions? “Implementing an Appeals Process at Accounting, Inc.”
If you were to design an appeals process to handle these complaints well, what would be the appeal process? Describe the recommended process and why.
The annual demand for water bottles at Mega Stores is 500 units, with an ordering cost of Rs. 200
per order. If the annual inventory holding cost is estimated to be 20%. of unit cost, how frequently
should he replenish his stocks? Further, suppose the supplier offers him a discount on bulk
ordering as given below. Can the manager reduce his costs by taking advantage of either of these
discounts? Recommend the best ordering policy for the store.
Order size Unit cost (Rs.)
1 – 49 pcs. 20.00
50 – 149 pcs. 19.50
150 – 299 pcs. 19.00
300 pcs. or more 18.00
Help answer showing level work and formulas
Chapter 8 Solutions
Operations Management: Processes and Supply Chains (11th Edition)
Ch. 8 - Figure 8.9 shows summer air visibility...Ch. 8 - Kay and Michael Passe publish What‘s...Ch. 8 - Demand for oil changes at Garcia’s Garage has...Ch. 8 - Prob. 2PCh. 8 - Ohio Swiss Milk Products manufactures and...Ch. 8 - A manufacturing firm has developed a skills test,...Ch. 8 - The materials handling manager of a manufacturing...Ch. 8 - Marianne Kramer, the owner of Handy Man Rentals,...Ch. 8 - Sales for the past 12 months at Computer Success...Ch. 8 - Bradley’s Copiers sells and repairs photocopy...
Ch. 8 - Consider the sales data for Computer Success given...Ch. 8 - A convenience store recently started to carry a...Ch. 8 - Community Federal Bank in Dothan, Alabama,...Ch. 8 - The number of heart surgeries performed at...Ch. 8 - The following data are for calculator sales in...Ch. 8 - Prob. 14PCh. 8 - Forrest and Dan make boxes of chocolates for which...Ch. 8 - The manager of Alaina’s Garden Center must make...Ch. 8 - The manager of a utility company in the Texas...Ch. 8 - Franklin Tooling, Inc., manufactures specialty...Ch. 8 - Create an Excel spreadsheet on your own that can...Ch. 8 - Prob. 20PCh. 8 - Using the data in Problem 20 and the Time-Series...Ch. 8 - Prob. 22PCh. 8 - Cannister, Inc., specializes in the manufacture of...Ch. 8 - The Midwest Computer Company serves a large number...Ch. 8 - A certain food item at P=0.20 (with a combination...Ch. 8 - Prob. 26PCh. 8 - Prob. 27PCh. 8 - A manufacturing firm seeks to develop a better...Ch. 8 - How much does the forecasting process at Deckers...Ch. 8 - Prob. 2VCCh. 8 - What factors make forecasting at Deckers...Ch. 8 - Prob. 4VCCh. 8 - Prob. 5VCCh. 8 - Comment on the forecasting system being used by...Ch. 8 - Develop your own forecast for bow rakes for each...
Additional Business Textbook Solutions
Find more solutions based on key concepts
Assume you are a CFO of a company that is attempting to race additional capital to finance an expansion of its ...
Financial Accounting, Student Value Edition (5th Edition)
Real options and its types. Introduction: The net present value is the variation between present cash inflows v...
Gitman: Principl Manageri Finance_15 (15th Edition) (What's New in Finance)
1-1. Define marketing and outline the steps in the marketing process. (AASCB: Communication)
Marketing: An Introduction (13th Edition)
Whether callable bonds have a higher or lower yield than otherwise identical bonds without a call feature. Intr...
Corporate Finance (4th Edition) (Pearson Series in Finance) - Standalone book
The Warm and Toasty Heating Oil Company used to deliver heating oil by sending trucks that printed out a ticket...
Essentials of MIS (13th Edition)
List five asset accounts, three liability accounts, and five expense accounts included in the acquisition and p...
Auditing And Assurance Services
Knowledge Booster


Learn more about
Need a deep-dive on the concept behind this application? Look no further. Learn more about this topic, operations-management and related others by exploring similar questions and additional content below.Similar questions
- I need to forecast using a 3-Period-Moving-Average-Monthly forecasting model which I did but then I need to use my forecast numbers to generate a Master Production Schedule (MPS) I have to Start with actual sales (my own test data numbers) for August-2022 Oct-2022 i need to create MPS to supply demand starting November-2022 April 2023 I just added numbers without applying formulas to the mps on the right side of the spreadsheet because I do not know how to do it. The second image is the example of what it should look like. Thank You.arrow_forwardSolve the following Question 1. How do volume and variety affect the process selection and layout types? Discuss 2. How is the human resource aspect important to operation function? Discuss 3. Discuss the supply network design and its impact on the overall performance of the organization.arrow_forwardHelp with question?arrow_forward
- What are some good examples of bullet points on a resume for a Christian Elementary School?arrow_forwardWhat is an example of a cover letter for a Christian School Long-Term Substitute Teaching position?arrow_forwardThe supply chain is a conventional notion, but organizations are only really interested in making products that they can sell to customers. Provided they have reliable supplies of materials and reasonable transport for finished products, logistics is irrelevant. Do you think this is true? If yes, explain, and if no, clearly explain as well.arrow_forward
- working as a program operations managerarrow_forward12 X1, X230 1 x =0x2 write the Following linear Programming model by 1- general Form Canonical Forms Canonical formY 2- Standard Form Max Z=35X+ 4 X 2 +6 X3 ST. X+2X2-5x3 = 40 3X, + 6X2 + 7x 3 = 30 7x, +lox2 x3 = 50 X3 X 2 X 3 <0arrow_forwarda/ a Minimum cost assign each worker for one job at Jobs J1 12 33 WI 2 4 6 W2 5 W3 5 33 6 7arrow_forward
- وبة واضافة هذه القيمة الى القيم Ex: Assign each job for each worker at minimum total Cost عمل لكل عامل وبأقل كلفة ممكنة obs الأعمال Workors العمال J1 J2 J3 J4 W₁ 15 13 14 12 W2 11 12 15 13 W3 13 12 10 11 W4 15 17 14 16arrow_forwardThe average completion time (flow time) for the sequence developed using the FCFS rule = 11.75 days (round your response to two decimal places). The percentage utilization for the sequence developed using the FCFS rule = 42.55 % (enter your response as a percentage rounded to two decimal places). b) Using the SPT (shortest processing time) decision rule for sequencing the jobs, the order is (to resolve a tie, use the order in which the jobs were received): An Alabama lumberyard has four jobs on order, as shown in the following table. Today is day 205 on the yard's schedule. In what sequence would the jobs be ranked according to the decision rules on the left: Job Due Date A 212 B 209 C 208 D 210 Duration (days) 6 3 3 8 Sequence 1 Job B 2 3 4 A D The average tardiness (job lateness) for the sequence developed using the SPT rule = 5.00 days (round your response to two decimal places). The average completion time (flow time) for the sequence developed using the SPT rule = 10.25 days…arrow_forwardWith the aid of examples, fully discuss any five (5) political tactics used in organisations.arrow_forward
arrow_back_ios
SEE MORE QUESTIONS
arrow_forward_ios
Recommended textbooks for you
 Practical Management ScienceOperations ManagementISBN:9781337406659Author:WINSTON, Wayne L.Publisher:Cengage,
 Contemporary MarketingMarketingISBN:9780357033777Author:Louis E. Boone, David L. KurtzPublisher:Cengage Learning
 MarketingMarketingISBN:9780357033791Author:Pride, William MPublisher:South Western Educational Publishing
Practical Management Science
Operations Management
ISBN:9781337406659
Author:WINSTON, Wayne L.
Publisher:Cengage,
Contemporary Marketing
Marketing
ISBN:9780357033777
Author:Louis E. Boone, David L. Kurtz
Publisher:Cengage Learning
Marketing
Marketing
ISBN:9780357033791
Author:Pride, William M
Publisher:South Western Educational Publishing
Single Exponential Smoothing & Weighted Moving Average Time Series Forecasting; Author: Matt Macarty;https://www.youtube.com/watch?v=IjETktmL4Kg;License: Standard YouTube License, CC-BY
Introduction to Forecasting - with Examples; Author: Dr. Bharatendra Rai;https://www.youtube.com/watch?v=98K7AG32qv8;License: Standard Youtube License