
Introductory Statistics (2nd Edition)
2nd Edition
ISBN: 9780321978271
Author: Robert Gould, Colleen N. Ryan
Publisher: PEARSON
expand_more
expand_more
format_list_bulleted
Concept explainers
Videos
Textbook Question
thumb_up100%
Chapter 8, Problem 34SE
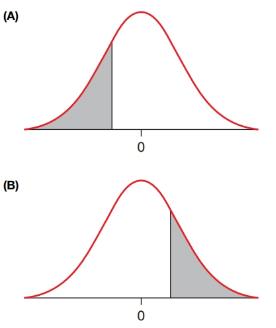
p-Values For each graph, state whether the shaded area could represent a p-value. Explain why or why not. If yes, state whether the area could represent the p-value for a one-sided or a two-sided alternative hypothesis.
Expert Solution & Answer

Trending nowThis is a popular solution!

Students have asked these similar questions
Question 2
The data below provides the battery life of thirty eight (38) motorcycle batteries.
100 83 83 105 110 81 114
99 101 105 78 115 74 96
106
89
94 81 106 91 93 86
79 103 94 108 113 100
117 120
77 93
93 85 76
89 78 88
680
a. Test the hypothesis that mean battery life is greater than 90. Use the 1% level of
significance.
b. Determine if the mean battery life is different from 80. Use the 10% level of
significance. Show all steps for the hypothesis test
c. Would your conlcusion in part (b) change at the 5% level of significance? |
d. Confirm test results in part (b) using JASP. Note: All JASP input files and output
tables should be provided
Suppose that 80% of athletes at a certain college graduate. You randomly select eight athletes. What’s the chance that at most 7 of them graduate?
Suppose that you flip a fair coin four times. What’s the chance of getting at least one head?
Chapter 8 Solutions
Introductory Statistics (2nd Edition)
Ch. 8 - Choose one of the answers given. The null...Ch. 8 - Choose one of the answers in each case. In...Ch. 8 - Boot Camp (Example 1) Suppose an experiment is...Ch. 8 - Scrubs A research hospital tries a new antibiotic...Ch. 8 - Magic A magician claims he can cause a coin to...Ch. 8 - Water A friend is tested to see whether he can...Ch. 8 - Heart Attack Prevention A new drug is being tested...Ch. 8 - Stroke Survival Rate The proportion of people who...Ch. 8 - Coin Flips (Example 2) A coin is flipped 30 times...Ch. 8 - Die Rolls You roll a six-sided die 30 times and...
Ch. 8 - Prob. 11SECh. 8 - Multiple-Choice Test A teacher is giving an exam...Ch. 8 - Dropouts According to Time magazine (June 11,...Ch. 8 - Prob. 14SECh. 8 - Boot Camp, Again (Example 4) Refer to Exercise...Ch. 8 - Prob. 16SECh. 8 - Coke versus Pepsi (Example 5) Suppose you are...Ch. 8 - St. Louis Jury Pool St. Louis County is 24 African...Ch. 8 - Coke vs. Pepsi (Example 6) Suppose you are testing...Ch. 8 - Prob. 20SECh. 8 - Cheating? A professor creates two versions of a 20...Ch. 8 - Guessing A 20-question multiple choice quiz has...Ch. 8 - Dreaming (Example 7) A 2003 study of dreaming...Ch. 8 - Age Discrimination About 30 of the population in...Ch. 8 - Marriage Obsolete (Example 8) When asked whether...Ch. 8 - Prob. 26SECh. 8 - Coke versus Pepsi A taste test is done to see...Ch. 8 - Seat Belts Suppose we are testing people to see...Ch. 8 - Sleep Walking (Example 9) According to Time...Ch. 8 - Prob. 30SECh. 8 - Sleep Walking, Again (Example 10) According to...Ch. 8 - Women CEOs, Again the percentage of female CEOs in...Ch. 8 - p-Values For each graph, indicate whether the...Ch. 8 - p-Values For each graph, state whether the shaded...Ch. 8 - Gun Control Historically, the percentage of U.S....Ch. 8 - Death Penalty A Pew Poll in November 2011 showed...Ch. 8 - Prob. 37SECh. 8 - Plane Crashes According to one source, 50 of plane...Ch. 8 - Mercury in Freshwater Fish Some experts believe...Ch. 8 - Prob. 40SECh. 8 - Morse’s Proportion of ts Samuel Morse determined...Ch. 8 - Morse’s Proportion of as Samuel Morse determined...Ch. 8 - p-Values (Example 11) A researcher carried out a...Ch. 8 - Coin Flips A test is conducted in which a coin is...Ch. 8 - Errors with Pennies (Example 12) Suppose you are...Ch. 8 - Errors with Toast Suppose you are testing someone...Ch. 8 - Blackstone on Errors in Trials Sir William...Ch. 8 - Alpha By establishing a small value for the...Ch. 8 - Flaws (Example 13) A person spinning a 1962 penny...Ch. 8 - Flaws The null hypothesis on true/false tests is...Ch. 8 - Which Method? A proponent of a new proposition on...Ch. 8 - Which Method? A proponent of a new proposition on...Ch. 8 - Effectiveness of Financial Incentives A...Ch. 8 - Is it acceptable practice to look at your research...Ch. 8 - If we reject the null hypothesis, can we claim to...Ch. 8 - If we do not reject the null hypothesis, is it...Ch. 8 - When a person stands trial for murder, the jury is...Ch. 8 - When, in a criminal court, a defendant is found...Ch. 8 - Arthritis A magazine advertisement claims that...Ch. 8 - No-Carb Diet A weight-loss diet claims that it...Ch. 8 - When comparing two sample proportions with a...Ch. 8 - When comparing two sample proportions with a...Ch. 8 - Prob. 63SECh. 8 - Prob. 64SECh. 8 - Prob. 65SECh. 8 - Prob. 66SECh. 8 - Prob. 67SECh. 8 - Prob. 68SECh. 8 - Smiling and Gender (Example 15) In a 1997 study,...Ch. 8 - Prob. 70SECh. 8 - Prob. 71CRECh. 8 - Prob. 72CRECh. 8 - Choosing a Test and Giving the Hypotheses Give the...Ch. 8 - Choosing a Test and Naming the Population(s) In...Ch. 8 - Prob. 75CRECh. 8 - Butter Taste Test A man is tested to determine...Ch. 8 - Biased Coin? A study is done to see whether a coin...Ch. 8 - Biased Coin? A study is done to see whether a coin...Ch. 8 - Prob. 79CRECh. 8 - Coin Flips Suppose you tested 50 coins by flipping...Ch. 8 - Prob. 81CRECh. 8 - Prob. 82CRECh. 8 - Prob. 83CRECh. 8 - Weight Loss in Men Many polls have asked people...Ch. 8 - Prob. 85CRECh. 8 - Prob. 86CRECh. 8 - Prob. 87CRECh. 8 - Prob. 88CRECh. 8 - Wording of Polls A poll in California (done by the...Ch. 8 - Prob. 90CRECh. 8 - Three-Strikes Law California’s controversial...Ch. 8 - Prob. 92CRECh. 8 - Prob. 93CRECh. 8 - Prob. 94CRECh. 8 - A friend claims he can predict the suit of a card...Ch. 8 - A friend claims he can predict how a six-sided die...Ch. 8 - Votes for Independents Judging on the basis of...Ch. 8 - Votes for Independents Refer to Exercise 8.97....Ch. 8 - Texting While Driving The mother of a teenager has...Ch. 8 - True/False Test A teacher giving a true/false test...Ch. 8 - ESP Suppose a friend says he can predict whether a...Ch. 8 - ESP Again Suppose a friend says he can predict...Ch. 8 - Does Hand Washing Save Lives? In the mid-1800s,...Ch. 8 - Prob. 104CRECh. 8 - Guessing on a True/False Test A true/false test...Ch. 8 - Guessing on a Multiple-Choice Test A...
Additional Math Textbook Solutions
Find more solutions based on key concepts
CHECK POINT I Consider the six jokes about books by Groucho Marx. Bob Blitzer. Steven Wright, HennyYoungman. Je...
Thinking Mathematically (6th Edition)
Is there a relationship between wine consumption and deaths from heart disease? The table gives data from 19 de...
College Algebra Essentials (5th Edition)
Let F be a continuous distribution function. If U is uniformly distributed on (0,1), find the distribution func...
A First Course in Probability (10th Edition)
1. How is a sample related to a population?
Elementary Statistics: Picturing the World (7th Edition)
Check Your Understanding
Reading Check Complete each sentence using > or < for □.
RC1. 3 dm □ 3 dam
Basic College Mathematics
The largest polynomial that divides evenly into a list of polynomials is called the _______.
Elementary & Intermediate Algebra
Knowledge Booster


Learn more about
Need a deep-dive on the concept behind this application? Look no further. Learn more about this topic, statistics and related others by exploring similar questions and additional content below.Similar questions
- Suppose that the chance that an elementary student eats hot lunch is 30 percent. What’s the chance that, among 20 randomly selected students, between 6 and 8 students eat hot lunch (inclusive)?arrow_forwardBob’s commuting times to work are varied. He makes it to work on time 80 percent of the time. On 12 randomly selected trips to work, what’s the chance that Bob makes it on time at least 10 times?arrow_forwardYour chance of winning a small prize in a scratch-off ticket is 10 percent. You buy five tickets. What’s the chance you will win at least one prize?arrow_forward
- Suppose that 60 percent of families own a pet. You randomly sample four families. What is the chance that two or three of them own a pet?arrow_forwardIf 40 percent of university students purchase their textbooks online, in a random sample of five students, what’s the chance that exactly one of them purchased their textbooks online?arrow_forwardA stoplight is green 40 percent of the time. If you stop at this light eight random times, what is the chance that it’s green exactly five times?arrow_forward
- If 10 percent of the parts made by a certain company are defective and have to be remade, what is the chance that a random sample of four parts has one that is defective?arrow_forwardQuestion 4 Fourteen individuals were given a complex puzzle to complete. The times in seconds was recorded for their first and second attempts and the results provided below: 1 2 3 first attempt 172 255 second attempt 70 4 5 114 248 218 194 270 267 66 6 7 230 219 341 174 8 10 9 210 261 347 218 200 281 199 308 268 243 236 300 11 12 13 14 140 302 a. Calculate a 95% confidence interval for the mean time taken by each individual to complete the (i) first attempt and (ii) second attempt. [la] b. Test the hypothesis that the difference between the two mean times for both is 100 seconds. Use the 5% level of significance. c. Subsequently, it was learnt that the times for the second attempt were incorrecly recorded and that each of the values is 50 seconds too large. What, if any, difference does this make to the results of the test done in part (b)? Show all steps for the hypothesis testarrow_forwardQuestion 3 3200 students were asked about the importance of study groups in successfully completing their courses. They were asked to provide their current majors as well as their opinion. The results are given below: Major Opinion Psychology Sociology Economics Statistics Accounting Total Agree 144 183 201 271 251 1050 Disagree 230 233 254 227 218 1162 Impartial 201 181 196 234 176 988 Total 575 597 651 732 645 3200 a. State both the null and alternative hypotheses. b. Provide the decision rule for making this decision. Use an alpha level of 5%. c. Show all of the work necessary to calculate the appropriate statistic. | d. What conclusion are you allowed to draw? c. Would your conclusion change at the 10% level of significance? f. Confirm test results in part (c) using JASP. Note: All JASP input files and output tables should be providedarrow_forward
- Question 1 A tech company has acknowledged the importance of having records of all meetings conducted. The meetings are very fast paced and requires equipment that is able to capture the information in the shortest possible time. There are two options, using a typewriter or a word processor. Fifteen administrative assistants are selected and the amount of typing time in hours was recorded. The results are given below: 1 2 3 4 5 6 7 8 9 10 11 12 13 14 15 typewriter 8.0 6.5 5.0 6.7 7.8 8.5 7.2 5.7 9.2 5.7 6.5 word processor 7.2 5.7 8.3 7.5 9.2 7.2 6.5 7.0 6.9 34 7.0 6.9 8.8 6.7 8.8 9.4 8.6 5.5 7.2 8.4 a. Test the hypothesis that the mean typing time in hours for typewriters is less than 7.0. Use the 1% level of significance. b. Construct a 90% confidence interval for the difference in mean typing time in hours, where a difference is equal to the typing time in hours of word processors minus typing time in hours of typewriter. c. Using the 5% significance level, determine whether there is…arrow_forwardIllustrate 2/7×4/5 using a rectangular region. Explain your work. arrow_forwardWrite three other different proportions equivalent to the following using the same values as in the given proportion 3 foot over 1 yard equals X feet over 5 yardsarrow_forward
arrow_back_ios
SEE MORE QUESTIONS
arrow_forward_ios
Recommended textbooks for you
 Glencoe Algebra 1, Student Edition, 9780079039897...AlgebraISBN:9780079039897Author:CarterPublisher:McGraw Hill
 Holt Mcdougal Larson Pre-algebra: Student Edition...AlgebraISBN:9780547587776Author:HOLT MCDOUGALPublisher:HOLT MCDOUGAL
 Big Ideas Math A Bridge To Success Algebra 1: Stu...AlgebraISBN:9781680331141Author:HOUGHTON MIFFLIN HARCOURTPublisher:Houghton Mifflin Harcourt
 College Algebra (MindTap Course List)AlgebraISBN:9781305652231Author:R. David Gustafson, Jeff HughesPublisher:Cengage Learning
 Algebra: Structure And Method, Book 1AlgebraISBN:9780395977224Author:Richard G. Brown, Mary P. Dolciani, Robert H. Sorgenfrey, William L. ColePublisher:McDougal Littell
Glencoe Algebra 1, Student Edition, 9780079039897...
Algebra
ISBN:9780079039897
Author:Carter
Publisher:McGraw Hill
Holt Mcdougal Larson Pre-algebra: Student Edition...
Algebra
ISBN:9780547587776
Author:HOLT MCDOUGAL
Publisher:HOLT MCDOUGAL
Big Ideas Math A Bridge To Success Algebra 1: Stu...
Algebra
ISBN:9781680331141
Author:HOUGHTON MIFFLIN HARCOURT
Publisher:Houghton Mifflin Harcourt
College Algebra (MindTap Course List)
Algebra
ISBN:9781305652231
Author:R. David Gustafson, Jeff Hughes
Publisher:Cengage Learning
Algebra: Structure And Method, Book 1
Algebra
ISBN:9780395977224
Author:Richard G. Brown, Mary P. Dolciani, Robert H. Sorgenfrey, William L. Cole
Publisher:McDougal Littell
Mod-01 Lec-01 Discrete probability distributions (Part 1); Author: nptelhrd;https://www.youtube.com/watch?v=6x1pL9Yov1k;License: Standard YouTube License, CC-BY
Discrete Probability Distributions; Author: Learn Something;https://www.youtube.com/watch?v=m9U4UelWLFs;License: Standard YouTube License, CC-BY
Probability Distribution Functions (PMF, PDF, CDF); Author: zedstatistics;https://www.youtube.com/watch?v=YXLVjCKVP7U;License: Standard YouTube License, CC-BY
Discrete Distributions: Binomial, Poisson and Hypergeometric | Statistics for Data Science; Author: Dr. Bharatendra Rai;https://www.youtube.com/watch?v=lHhyy4JMigg;License: Standard Youtube License