
Introductory Statistics (2nd Edition)
2nd Edition
ISBN: 9780321978271
Author: Robert Gould, Colleen N. Ryan
Publisher: PEARSON
expand_more
expand_more
format_list_bulleted
Videos
Textbook Question
Chapter 8, Problem 33SE
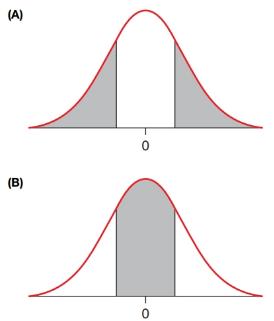
p-Values For each graph, indicate whether the shaded area could represent a p-value. Explain why or why not. If yes, state whether the area could represent the p-value for a one-sided or a two-sided alternative hypothesis.
Expert Solution & Answer
Want to see the full answer?
Check out a sample textbook solution
Students have asked these similar questions
BUSINESS DISCUSS
A researcher wishes to estimate, with 90% confidence, the population proportion of adults who support labeling
legislation for genetically modified organisms (GMOs). Her estimate must be accurate within 4% of the true proportion.
(a) No preliminary estimate is available. Find the minimum sample size needed.
(b) Find the minimum sample size needed, using a prior study that found that 65% of the respondents said they support
labeling legislation for GMOs.
(c) Compare the results from parts (a) and (b).
...
(a) What is the minimum sample size needed assuming that no prior information is available?
n =
(Round up to the nearest whole number as needed.)
The table available below shows the costs per mile (in cents) for a sample of automobiles. At a = 0.05, can you conclude that at least one mean
cost per mile is different from the others?
Click on the icon to view the data table.
Let Hss, HMS, HLS, Hsuv and Hмy represent the mean costs per mile for small sedans, medium sedans, large sedans, SUV 4WDs, and minivans
respectively. What are the hypotheses for this test?
OA. Ho: Not all the means are equal.
Ha Hss HMS HLS HSUV HMV
B. Ho Hss HMS HLS HSUV = μMV
Ha: Hss *HMS *HLS*HSUV * HMV
C. Ho Hss HMS HLS HSUV =μMV
= =
H: Not all the means are equal.
D. Ho Hss HMS
HLS HSUV HMV
Ha Hss HMS
HLS =HSUV = HMV
Chapter 8 Solutions
Introductory Statistics (2nd Edition)
Ch. 8 - Choose one of the answers given. The null...Ch. 8 - Choose one of the answers in each case. In...Ch. 8 - Boot Camp (Example 1) Suppose an experiment is...Ch. 8 - Scrubs A research hospital tries a new antibiotic...Ch. 8 - Magic A magician claims he can cause a coin to...Ch. 8 - Water A friend is tested to see whether he can...Ch. 8 - Heart Attack Prevention A new drug is being tested...Ch. 8 - Stroke Survival Rate The proportion of people who...Ch. 8 - Coin Flips (Example 2) A coin is flipped 30 times...Ch. 8 - Die Rolls You roll a six-sided die 30 times and...
Ch. 8 - Prob. 11SECh. 8 - Multiple-Choice Test A teacher is giving an exam...Ch. 8 - Dropouts According to Time magazine (June 11,...Ch. 8 - Prob. 14SECh. 8 - Boot Camp, Again (Example 4) Refer to Exercise...Ch. 8 - Prob. 16SECh. 8 - Coke versus Pepsi (Example 5) Suppose you are...Ch. 8 - St. Louis Jury Pool St. Louis County is 24 African...Ch. 8 - Coke vs. Pepsi (Example 6) Suppose you are testing...Ch. 8 - Prob. 20SECh. 8 - Cheating? A professor creates two versions of a 20...Ch. 8 - Guessing A 20-question multiple choice quiz has...Ch. 8 - Dreaming (Example 7) A 2003 study of dreaming...Ch. 8 - Age Discrimination About 30 of the population in...Ch. 8 - Marriage Obsolete (Example 8) When asked whether...Ch. 8 - Prob. 26SECh. 8 - Coke versus Pepsi A taste test is done to see...Ch. 8 - Seat Belts Suppose we are testing people to see...Ch. 8 - Sleep Walking (Example 9) According to Time...Ch. 8 - Prob. 30SECh. 8 - Sleep Walking, Again (Example 10) According to...Ch. 8 - Women CEOs, Again the percentage of female CEOs in...Ch. 8 - p-Values For each graph, indicate whether the...Ch. 8 - p-Values For each graph, state whether the shaded...Ch. 8 - Gun Control Historically, the percentage of U.S....Ch. 8 - Death Penalty A Pew Poll in November 2011 showed...Ch. 8 - Prob. 37SECh. 8 - Plane Crashes According to one source, 50 of plane...Ch. 8 - Mercury in Freshwater Fish Some experts believe...Ch. 8 - Prob. 40SECh. 8 - Morse’s Proportion of ts Samuel Morse determined...Ch. 8 - Morse’s Proportion of as Samuel Morse determined...Ch. 8 - p-Values (Example 11) A researcher carried out a...Ch. 8 - Coin Flips A test is conducted in which a coin is...Ch. 8 - Errors with Pennies (Example 12) Suppose you are...Ch. 8 - Errors with Toast Suppose you are testing someone...Ch. 8 - Blackstone on Errors in Trials Sir William...Ch. 8 - Alpha By establishing a small value for the...Ch. 8 - Flaws (Example 13) A person spinning a 1962 penny...Ch. 8 - Flaws The null hypothesis on true/false tests is...Ch. 8 - Which Method? A proponent of a new proposition on...Ch. 8 - Which Method? A proponent of a new proposition on...Ch. 8 - Effectiveness of Financial Incentives A...Ch. 8 - Is it acceptable practice to look at your research...Ch. 8 - If we reject the null hypothesis, can we claim to...Ch. 8 - If we do not reject the null hypothesis, is it...Ch. 8 - When a person stands trial for murder, the jury is...Ch. 8 - When, in a criminal court, a defendant is found...Ch. 8 - Arthritis A magazine advertisement claims that...Ch. 8 - No-Carb Diet A weight-loss diet claims that it...Ch. 8 - When comparing two sample proportions with a...Ch. 8 - When comparing two sample proportions with a...Ch. 8 - Prob. 63SECh. 8 - Prob. 64SECh. 8 - Prob. 65SECh. 8 - Prob. 66SECh. 8 - Prob. 67SECh. 8 - Prob. 68SECh. 8 - Smiling and Gender (Example 15) In a 1997 study,...Ch. 8 - Prob. 70SECh. 8 - Prob. 71CRECh. 8 - Prob. 72CRECh. 8 - Choosing a Test and Giving the Hypotheses Give the...Ch. 8 - Choosing a Test and Naming the Population(s) In...Ch. 8 - Prob. 75CRECh. 8 - Butter Taste Test A man is tested to determine...Ch. 8 - Biased Coin? A study is done to see whether a coin...Ch. 8 - Biased Coin? A study is done to see whether a coin...Ch. 8 - Prob. 79CRECh. 8 - Coin Flips Suppose you tested 50 coins by flipping...Ch. 8 - Prob. 81CRECh. 8 - Prob. 82CRECh. 8 - Prob. 83CRECh. 8 - Weight Loss in Men Many polls have asked people...Ch. 8 - Prob. 85CRECh. 8 - Prob. 86CRECh. 8 - Prob. 87CRECh. 8 - Prob. 88CRECh. 8 - Wording of Polls A poll in California (done by the...Ch. 8 - Prob. 90CRECh. 8 - Three-Strikes Law California’s controversial...Ch. 8 - Prob. 92CRECh. 8 - Prob. 93CRECh. 8 - Prob. 94CRECh. 8 - A friend claims he can predict the suit of a card...Ch. 8 - A friend claims he can predict how a six-sided die...Ch. 8 - Votes for Independents Judging on the basis of...Ch. 8 - Votes for Independents Refer to Exercise 8.97....Ch. 8 - Texting While Driving The mother of a teenager has...Ch. 8 - True/False Test A teacher giving a true/false test...Ch. 8 - ESP Suppose a friend says he can predict whether a...Ch. 8 - ESP Again Suppose a friend says he can predict...Ch. 8 - Does Hand Washing Save Lives? In the mid-1800s,...Ch. 8 - Prob. 104CRECh. 8 - Guessing on a True/False Test A true/false test...Ch. 8 - Guessing on a Multiple-Choice Test A...
Additional Math Textbook Solutions
Find more solutions based on key concepts
(a) Make a stem-and-leaf plot for these 24 observations on the number of customers who used a down-town CitiBan...
APPLIED STAT.IN BUS.+ECONOMICS
For each hour of class time, how many hours outside of class are recommended for studying and doing homework?
Elementary Algebra For College Students (10th Edition)
Provide an example of a qualitative variable and an example of a quantitative variable.
Elementary Statistics ( 3rd International Edition ) Isbn:9781260092561
CHECK POINT I Consider the six jokes about books by Groucho Marx. Bob Blitzer. Steven Wright, HennyYoungman. Je...
Thinking Mathematically (6th Edition)
Use the ideas in drawings a and b to find the solution to Gausss Problem for the sum 1+2+3+...+n. Explain your ...
A Problem Solving Approach To Mathematics For Elementary School Teachers (13th Edition)
Fill in each blank so that the resulting statement is true.
1. The degree of the polynomial function is _____....
Algebra and Trigonometry (6th Edition)
Knowledge Booster


Learn more about
Need a deep-dive on the concept behind this application? Look no further. Learn more about this topic, statistics and related others by exploring similar questions and additional content below.Similar questions
- Question: A company launches two different marketing campaigns to promote the same product in two different regions. After one month, the company collects the sales data (in units sold) from both regions to compare the effectiveness of the campaigns. The company wants to determine whether there is a significant difference in the mean sales between the two regions. Perform a two sample T-test You can provide your answer by inserting a text box and the answer must include: Null hypothesis, Alternative hypothesis, Show answer (output table/summary table), and Conclusion based on the P value. (2 points = 0.5 x 4 Answers) Each of these is worth 0.5 points. However, showing the calculation is must. If calculation is missing, the whole answer won't get any credit.arrow_forwardBinomial Prob. Question: A new teaching method claims to improve student engagement. A survey reveals that 60% of students find this method engaging. If 15 students are randomly selected, what is the probability that: a) Exactly 9 students find the method engaging?b) At least 7 students find the method engaging? (2 points = 1 x 2 answers) Provide answers in the yellow cellsarrow_forwardIn a survey of 2273 adults, 739 say they believe in UFOS. Construct a 95% confidence interval for the population proportion of adults who believe in UFOs. A 95% confidence interval for the population proportion is ( ☐, ☐ ). (Round to three decimal places as needed.)arrow_forward
- Find the minimum sample size n needed to estimate μ for the given values of c, σ, and E. C=0.98, σ 6.7, and E = 2 Assume that a preliminary sample has at least 30 members. n = (Round up to the nearest whole number.)arrow_forwardIn a survey of 2193 adults in a recent year, 1233 say they have made a New Year's resolution. Construct 90% and 95% confidence intervals for the population proportion. Interpret the results and compare the widths of the confidence intervals. The 90% confidence interval for the population proportion p is (Round to three decimal places as needed.) J.D) .arrow_forwardLet p be the population proportion for the following condition. Find the point estimates for p and q. In a survey of 1143 adults from country A, 317 said that they were not confident that the food they eat in country A is safe. The point estimate for p, p, is (Round to three decimal places as needed.) ...arrow_forward
- (c) Because logistic regression predicts probabilities of outcomes, observations used to build a logistic regression model need not be independent. A. false: all observations must be independent B. true C. false: only observations with the same outcome need to be independent I ANSWERED: A. false: all observations must be independent. (This was marked wrong but I have no idea why. Isn't this a basic assumption of logistic regression)arrow_forwardBusiness discussarrow_forwardSpam filters are built on principles similar to those used in logistic regression. We fit a probability that each message is spam or not spam. We have several variables for each email. Here are a few: to_multiple=1 if there are multiple recipients, winner=1 if the word 'winner' appears in the subject line, format=1 if the email is poorly formatted, re_subj=1 if "re" appears in the subject line. A logistic model was fit to a dataset with the following output: Estimate SE Z Pr(>|Z|) (Intercept) -0.8161 0.086 -9.4895 0 to_multiple -2.5651 0.3052 -8.4047 0 winner 1.5801 0.3156 5.0067 0 format -0.1528 0.1136 -1.3451 0.1786 re_subj -2.8401 0.363 -7.824 0 (a) Write down the model using the coefficients from the model fit.log_odds(spam) = -0.8161 + -2.5651 + to_multiple + 1.5801 winner + -0.1528 format + -2.8401 re_subj(b) Suppose we have an observation where to_multiple=0, winner=1, format=0, and re_subj=0. What is the predicted probability that this message is spam?…arrow_forward
- Consider an event X comprised of three outcomes whose probabilities are 9/18, 1/18,and 6/18. Compute the probability of the complement of the event. Question content area bottom Part 1 A.1/2 B.2/18 C.16/18 D.16/3arrow_forwardJohn and Mike were offered mints. What is the probability that at least John or Mike would respond favorably? (Hint: Use the classical definition.) Question content area bottom Part 1 A.1/2 B.3/4 C.1/8 D.3/8arrow_forwardThe details of the clock sales at a supermarket for the past 6 weeks are shown in the table below. The time series appears to be relatively stable, without trend, seasonal, or cyclical effects. The simple moving average value of k is set at 2. What is the simple moving average root mean square error? Round to two decimal places. Week Units sold 1 88 2 44 3 54 4 65 5 72 6 85 Question content area bottom Part 1 A. 207.13 B. 20.12 C. 14.39 D. 0.21arrow_forward
arrow_back_ios
SEE MORE QUESTIONS
arrow_forward_ios
Recommended textbooks for you
 Glencoe Algebra 1, Student Edition, 9780079039897...AlgebraISBN:9780079039897Author:CarterPublisher:McGraw Hill
 Holt Mcdougal Larson Pre-algebra: Student Edition...AlgebraISBN:9780547587776Author:HOLT MCDOUGALPublisher:HOLT MCDOUGAL
 Big Ideas Math A Bridge To Success Algebra 1: Stu...AlgebraISBN:9781680331141Author:HOUGHTON MIFFLIN HARCOURTPublisher:Houghton Mifflin Harcourt
 Algebra: Structure And Method, Book 1AlgebraISBN:9780395977224Author:Richard G. Brown, Mary P. Dolciani, Robert H. Sorgenfrey, William L. ColePublisher:McDougal Littell
Glencoe Algebra 1, Student Edition, 9780079039897...
Algebra
ISBN:9780079039897
Author:Carter
Publisher:McGraw Hill
Holt Mcdougal Larson Pre-algebra: Student Edition...
Algebra
ISBN:9780547587776
Author:HOLT MCDOUGAL
Publisher:HOLT MCDOUGAL
Big Ideas Math A Bridge To Success Algebra 1: Stu...
Algebra
ISBN:9781680331141
Author:HOUGHTON MIFFLIN HARCOURT
Publisher:Houghton Mifflin Harcourt
Algebra: Structure And Method, Book 1
Algebra
ISBN:9780395977224
Author:Richard G. Brown, Mary P. Dolciani, Robert H. Sorgenfrey, William L. Cole
Publisher:McDougal Littell
Hypothesis Testing using Confidence Interval Approach; Author: BUM2413 Applied Statistics UMP;https://www.youtube.com/watch?v=Hq1l3e9pLyY;License: Standard YouTube License, CC-BY
Hypothesis Testing - Difference of Two Means - Student's -Distribution & Normal Distribution; Author: The Organic Chemistry Tutor;https://www.youtube.com/watch?v=UcZwyzwWU7o;License: Standard Youtube License