
Videos
Todo:Graph the region corresponding to the system of constraints given below. Then find the minimum and maximum values of the objective function and the points where they occur, subject to the constraints.
Objective function:
Constraints:
Answer to Problem 17E
The region corresponding to the system of constraints is

The minimum value of
The maximum value of
Explanation of Solution
Given:
Objective function:
Constraints:
Concept Used:
To find the minimum and maximum values of the objective function.
First plot the given constraints on the graph and find the bounded region. Then evaluating the objective function at each of the vertex of the bounded region results into the minimum and maximum value of the function.
Calculation:
For the given
Objective function:
Constraints:
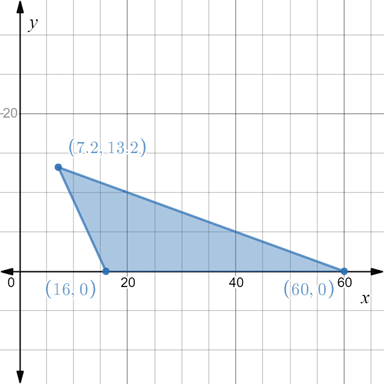
Plotting the given constraints on a graph,
Let
Consider the equation
and
Consider
At
At
Consider
At
At
Plotting the region bounded by the given constraints, we have

Evaluating the objective function at each vertex
At
At
At
The minimum value of
The maximum value of
Conclusion:
The region corresponding to the system of constraints is
The minimum value of
The maximum value of
Chapter 7 Solutions
EBK PRECALCULUS W/LIMITS


- Evaluate the double integral ' √ √ (−2xy² + 3ry) dA R where R = {(x,y)| 1 ≤ x ≤ 3, 2 ≤ y ≤ 4} Double Integral Plot of integrand and Region R N 120 100 80- 60- 40 20 -20 -40 2 T 3 4 5123456 This plot is an example of the function over region R. The region and function identified in your problem will be slightly different. Answer = Round your answer to four decimal places.arrow_forwardFind Te²+ dydz 0 Write your answer in exact form.arrow_forwardxy² Find -dA, R = [0,3] × [−4,4] x²+1 Round your answer to four decimal places.arrow_forward
- Find the values of p for which the series is convergent. P-?- ✓ 00 Σ nº (1 + n10)p n = 1 Need Help? Read It Watch It SUBMIT ANSWER [-/4 Points] DETAILS MY NOTES SESSCALCET2 8.3.513.XP. Consider the following series. 00 Σ n = 1 1 6 n° (a) Use the sum of the first 10 terms to estimate the sum of the given series. (Round the answer to six decimal places.) $10 = (b) Improve this estimate using the following inequalities with n = 10. (Round your answers to six decimal places.) Sn + + Los f(x) dx ≤s ≤ S₁ + Jn + 1 + Lo f(x) dx ≤s ≤ (c) Using the Remainder Estimate for the Integral Test, find a value of n that will ensure that the error in the approximation s≈s is less than 0.0000001. On > 11 n> -18 On > 18 On > 0 On > 6 Need Help? Read It Watch Itarrow_forward√5 Find Lª³ L² y-are y- arctan (+) dy dydx. Hint: Use integration by parts. SolidUnderSurface z=y*arctan(1/x) Z1 2 y 1 1 Round your answer to 4 decimal places.arrow_forwardFor the solid lying under the surface z = √√4-² and bounded by the rectangular region R = [0,2]x[0,2] as illustrated in this graph: Double Integral Plot of integrand over Region R 1.5 Z 1- 0.5- 0 0.5 1 1.5 205115 Answer should be in exact math format. For example, some multiple of .arrow_forward
- Find 2 S² 0 0 (4x+2y)5dxdyarrow_forward(14 points) Let S = {(x, y, z) | z = e−(x²+y²), x² + y² ≤ 1}. The surface is the graph of ze(+2) sitting over the unit disk.arrow_forward6. Solve the system of differential equations using Laplace Transforms: x(t) = 3x₁ (t) + 4x2(t) x(t) = -4x₁(t) + 3x2(t) x₁(0) = 1,x2(0) = 0arrow_forward
- 3. Determine the Laplace Transform for the following functions. Show all of your work: 1-t, 0 ≤t<3 a. e(t) = t2, 3≤t<5 4, t≥ 5 b. f(t) = f(tt)e-3(-) cos 4τ drarrow_forward4. Find the inverse Laplace Transform Show all of your work: a. F(s) = = 2s-3 (s²-10s+61)(5-3) se-2s b. G(s) = (s+2)²arrow_forward1. Consider the differential equation, show all of your work: dy =(y2)(y+1) dx a. Determine the equilibrium solutions for the differential equation. b. Where is the differential equation increasing or decreasing? c. Where are the changes in concavity? d. Suppose that y(0)=0, what is the value of y as t goes to infinity?arrow_forward
 Calculus: Early TranscendentalsCalculusISBN:9781285741550Author:James StewartPublisher:Cengage Learning
 Thomas' Calculus (14th Edition)CalculusISBN:9780134438986Author:Joel R. Hass, Christopher E. Heil, Maurice D. WeirPublisher:PEARSON
 Calculus: Early Transcendentals (3rd Edition)CalculusISBN:9780134763644Author:William L. Briggs, Lyle Cochran, Bernard Gillett, Eric SchulzPublisher:PEARSON
 Calculus: Early TranscendentalsCalculusISBN:9781319050740Author:Jon Rogawski, Colin Adams, Robert FranzosaPublisher:W. H. Freeman
 Calculus: Early Transcendental FunctionsCalculusISBN:9781337552516Author:Ron Larson, Bruce H. EdwardsPublisher:Cengage Learning