
Managerial Accounting
15th Edition
ISBN: 9781337912020
Author: Carl Warren, Ph.d. Cma William B. Tayler
Publisher: South-Western College Pub
expand_more
expand_more
format_list_bulleted
Videos
Textbook Question
Chapter 7, Problem 4MAD
Segment disclosure by Apple Inc. (AAPL) provides sales information for its major product lines for three recent years as follows (in millions):
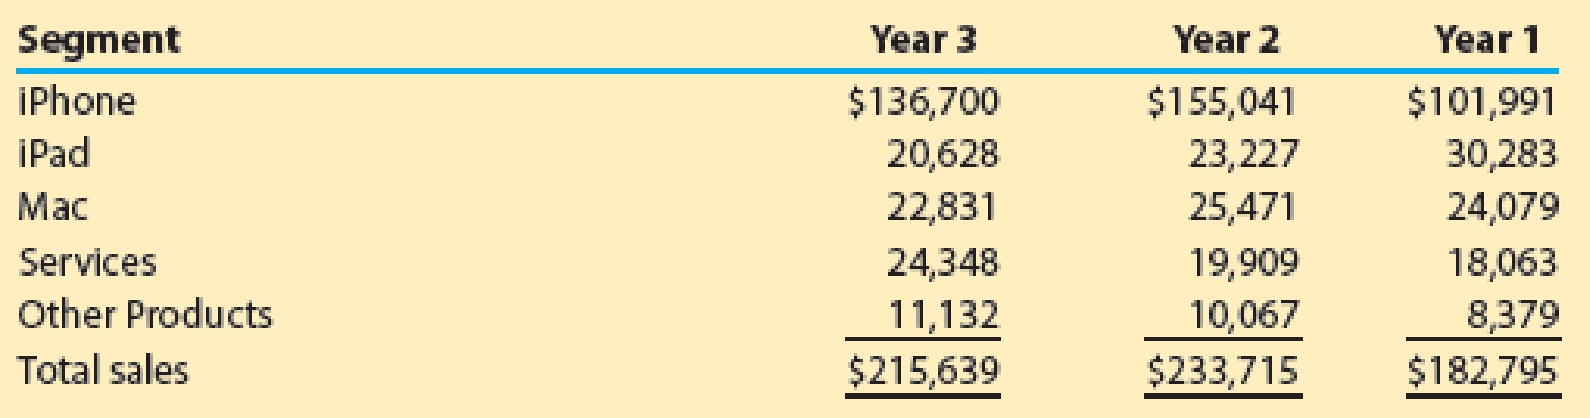
The Services segment includes sales from iTunes Store, App Store, Mac App Store, TV App Store, iBooks Store, Apple Music, AppleCare, and Apple Pay. The Other Products segment includes sales from Apple TV, Apple Watch, Beats products, iPod, and Apple-branded accessories.
- a. Which product had the greatest percentage of Year 3 sales? Which product had the least percentage of Year 3 sales? Round to nearest whole percent.
- b. Which product grew the most in sales, in percentage terms, using Year 1 as the base year? Round to nearest whole percent.
Expert Solution & Answer
Want to see the full answer?
Check out a sample textbook solution
Students have asked these similar questions
Expand upon it and add more info
JH, Inc., is a calendar year, accrual basis corporation with Joe as its sole shareholder (basis in his stock is $90,000). On January 1 of the current year, JH Corporation has accumulated E & P of $200,000. Before considering the effect of the distribution described below, the corporation’s current E & P is $50,000. On November 1, JH distributes an office building to Joe. The office building has an adjusted basis of $80,000 (fair market value of $100,000) and is subject to a mortgage of $110,000. Assume that the building has been depreciated using the ADS method for both income tax and E & P purposes. What are the tax consequences of the distribution to JH and to Joe? (In your answer, be sure to describe the effects on taxable income for both JH and Joe, the impact of the distribution on JH’s E & P, and Joe’s basis in the building.)
Joe is the sole shareholder of JH Corporation. Joe sold his stock to Ethan on October 31 for $150,000. Joe’s basis in JH stock was $50,000 at the start of the year. JH distributed land to Joe immediately before the sale. JH’s basis in the land was $20,000 (fair market value of $25,000). On December 31, Ethan received a $75,000 cash distribution from JH. During the year, JH has $20,000 of current E & P and its accumulated E & P balance on January 1 is $10,000. Which of the following statements is true?
a. Joe recognizes a $110,000 gain on the sale of his stock. b. Joe recognizes a $100,000 gain on the sale of his stock. c. Ethan receives $5,000 of dividend income.d. Joe receives $20,000 of dividend income. e. None of the above.
Chapter 7 Solutions
Managerial Accounting
Ch. 7 - What types of costs are customarily included in...Ch. 7 - Which type of manufacturing cost (direct...Ch. 7 - Which of the following costs would be included in...Ch. 7 - In the variable costing income statement, how are...Ch. 7 - Prob. 5DQCh. 7 - Prob. 6DQCh. 7 - Discuss how financial data prepared on the basis...Ch. 7 - Prob. 8DQCh. 7 - Explain why rewarding sales personnel on the basis...Ch. 7 - Explain why service companies use different...
Ch. 7 - Variable costing Marley Company has the following...Ch. 7 - Prob. 2BECh. 7 - Variable costingsales exceed production The...Ch. 7 - Prob. 4BECh. 7 - Contribution margin by segment The following...Ch. 7 - At the end of the first year of operations, 21,500...Ch. 7 - Gallatin County Motors Inc. assembles and sells...Ch. 7 - Fresno Industries Inc. manufactures and sells...Ch. 7 - On March 31, the end of the first month of...Ch. 7 - On April 30, the end of the first month of...Ch. 7 - On October 31, the end of the first month of...Ch. 7 - The following data were adapted from a recent...Ch. 7 - Estimated income statements, using absorption and...Ch. 7 - The following data were adapted from a recent...Ch. 7 - Prob. 10ECh. 7 - Explain why service companies use different...Ch. 7 - Galaxy Sports Inc. manufactures and sells two...Ch. 7 - Prob. 13ECh. 7 - Sales territory and salesperson profitability...Ch. 7 - Prob. 15ECh. 7 - Prob. 16ECh. 7 - Variable costing income statement for a service...Ch. 7 - Variable costing income statement for a service...Ch. 7 - Prob. 1PACh. 7 - The demand for solvent, one of numerous products...Ch. 7 - During the first month of operations ended May 31,...Ch. 7 - Salespersons report and analysis Walthman...Ch. 7 - Segment variable costing income statement and...Ch. 7 - Absorption and variable costing income statements...Ch. 7 - Income statements under absorption costing and...Ch. 7 - Absorption and variable costing income statements...Ch. 7 - Prob. 4PBCh. 7 - Variable costing income statement and effect on...Ch. 7 - Prob. 1MADCh. 7 - Prob. 2MADCh. 7 - Prob. 3MADCh. 7 - Segment disclosure by Apple Inc. (AAPL) provides...Ch. 7 - Prob. 1TIFCh. 7 - Inventory effects under absorption costing BendOR,...Ch. 7 - Communication Bon Jager Inc. manufactures and...Ch. 7 - Prob. 1CMACh. 7 - Chassen Company, a cracker and cookie...Ch. 7 - Prob. 3CMACh. 7 - Bethany Company has just completed the first month...
Knowledge Booster


Learn more about
Need a deep-dive on the concept behind this application? Look no further. Learn more about this topic, accounting and related others by exploring similar questions and additional content below.Similar questions
- Please provide the accurate answer to this general accounting problem using appropriate methods.arrow_forwardPlease provide the accurate answer to this general accounting problem using appropriate methods.arrow_forwardI need help with this general accounting question using standard accounting techniques.arrow_forward
- Can you help me solve this general accounting question using valid accounting techniques?arrow_forwardCan you solve this general accounting question with accurate accounting calculations?arrow_forwardI am looking for the correct answer to this general accounting problem using valid accounting standards.arrow_forward
- I am searching for the accurate solution to this general accounting problem with the right approach.arrow_forwardCan you solve this general accounting problem with appropriate steps and explanations?arrow_forwardPlease explain the solution to this general accounting problem using the correct accounting principles.arrow_forward
arrow_back_ios
SEE MORE QUESTIONS
arrow_forward_ios
Recommended textbooks for you
 Managerial AccountingAccountingISBN:9781337912020Author:Carl Warren, Ph.d. Cma William B. TaylerPublisher:South-Western College Pub
 Financial And Managerial AccountingAccountingISBN:9781337902663Author:WARREN, Carl S.Publisher:Cengage Learning,
 Financial AccountingAccountingISBN:9781337272124Author:Carl Warren, James M. Reeve, Jonathan DuchacPublisher:Cengage Learning
 Financial & Managerial AccountingAccountingISBN:9781337119207Author:Carl Warren, James M. Reeve, Jonathan DuchacPublisher:Cengage Learning
 Principles of Accounting Volume 2AccountingISBN:9781947172609Author:OpenStaxPublisher:OpenStax College
 Financial AccountingAccountingISBN:9781305088436Author:Carl Warren, Jim Reeve, Jonathan DuchacPublisher:Cengage Learning
Managerial Accounting
Accounting
ISBN:9781337912020
Author:Carl Warren, Ph.d. Cma William B. Tayler
Publisher:South-Western College Pub
Financial And Managerial Accounting
Accounting
ISBN:9781337902663
Author:WARREN, Carl S.
Publisher:Cengage Learning,
Financial Accounting
Accounting
ISBN:9781337272124
Author:Carl Warren, James M. Reeve, Jonathan Duchac
Publisher:Cengage Learning
Financial & Managerial Accounting
Accounting
ISBN:9781337119207
Author:Carl Warren, James M. Reeve, Jonathan Duchac
Publisher:Cengage Learning
Principles of Accounting Volume 2
Accounting
ISBN:9781947172609
Author:OpenStax
Publisher:OpenStax College
Financial Accounting
Accounting
ISBN:9781305088436
Author:Carl Warren, Jim Reeve, Jonathan Duchac
Publisher:Cengage Learning
How To Analyze an Income Statement; Author: Daniel Pronk;https://www.youtube.com/watch?v=uVHGgSXtQmE;License: Standard Youtube License