Concept explainers
Videos
To estimate: The K value from the given data that describes the ligand binding to a protein.
Concept introduction: Dissociation constant is the equilibrium constant at which the ligand dissociates from the protein. It is denoted as K. Y is fractional saturation of the ligand occupying the ligand-binding site in the protein, or it can be defined as the number of ligands that has dissociated from the protein. K is achieved when fractional saturation is half at a particular ligand concentration.
Answer to Problem 1E
Answer: The dissociation constant is estimated by plotting the values in a graph and finding the ligand concentration when Y is 0.5 (half of fractional saturation).
Pictorial representation:
Fig.1 shows a graph with ligand (mM) in the X-axis and Y in the Y-axis.
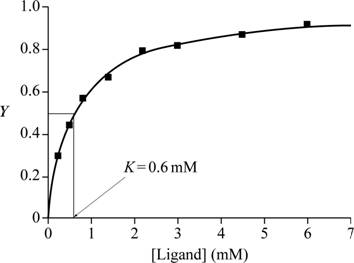
Fig.1: Graph of ligand (mM) vs Y to estimate K.
Explanation of Solution
Explanation:
When fractional saturation is half, it means that the ligand has occupied half of the ligand binding site in the protein. When fractional saturation is half, half of the ligand is bound to half the number of proteins in the medium. Half of proteins and half of ligands are free in the medium. This can be called as the equilibrium state of the ligand-protein binding reaction, and thus K is obtained at half of the fractional saturation.
A graph is plotted with ligand concentration in mM on the X-axis and Y, the fractional saturation, on the Y-axis with the given data. At half of fractional saturation, that is, at equilibrium state, the corresponding ligand concentration is 0.6 Mm, which is evident from the graph.
Conclusion: From the graph plotted for the given values, the K value is 0.6mM.
Want to see more full solutions like this?
Chapter 7 Solutions
Fundamentals of Biochemistry: Life at the Molecular Level


- Which features of the curves in Figure 30-2 indicates that the enzyme is not consumed in the overall reaction? ES is lower in energy that E + S and EP is lower in energy than E + P. What does this tell you about the stability of ES versus E + S and EP versus E + P.arrow_forwardLooking at the figure 30-5 what intermolecular forces are present between the substrate and the enzyme and the substrate and cofactors.arrow_forwardprovide short answers to the followings Urgent!arrow_forward
- Pyruvate is accepted into the TCA cycle by a “feeder” reaction using the pyruvatedehydrogenase complex, resulting in acetyl-CoA and CO2. Provide a full mechanismfor this reaction utilizing the TPP cofactor. Include the roles of all cofactors.arrow_forwardB- Vitamins are converted readily into important metabolic cofactors. Deficiency inany one of them has serious side effects. a. The disease beriberi results from a vitamin B 1 (Thiamine) deficiency and ischaracterized by cardiac and neurological symptoms. One key diagnostic forthis disease is an increased level of pyruvate and α-ketoglutarate in thebloodstream. How does this vitamin deficiency lead to increased serumlevels of these factors? b. What would you expect the effect on the TCA intermediates for a patientsuffering from vitamin B 5 deficiency? c. What would you expect the effect on the TCA intermediates for a patientsuffering from vitamin B 2 /B 3 deficiency?arrow_forwardDraw the Krebs Cycle and show the entry points for the amino acids Alanine,Glutamic Acid, Asparagine, and Valine into the Krebs Cycle - (Draw the Mechanism). How many rounds of Krebs will be required to waste all Carbons of Glutamic Acidas CO2?arrow_forward
- Sodium fluoroacetate (FCH 2CO2Na) is a very toxic molecule that is used as rodentpoison. It is converted enzymatically to fluoroacetyl-CoA and is utilized by citratesynthase to generate (2R,3S)-fluorocitrate. The release of this product is a potentinhibitor of the next enzyme in the TCA cycle. Show the mechanism for theproduction of fluorocitrate and explain how this molecule acts as a competitiveinhibitor. Predict the effect on the concentrations of TCA intermediates.arrow_forwardIndicate for the reactions below which type of enzyme and cofactor(s) (if any) wouldbe required to catalyze each reaction shown. 1) Fru-6-P + Ery-4-P <--> GAP + Sed-7-P2) Fru-6-P + Pi <--> Fru-1,6-BP + H2O3) GTP + ADP <--> GDP + ATP4) Sed-7-P + GAP <--> Rib-5-P + Xyl-5-P5) Oxaloacetate + GTP ---> PEP + GDP + CO 26) DHAP + Ery-4-P <--> Sed-1,7-BP + H 2O7) Pyruvate + ATP + HCO3- ---> Oxaloacetate + ADP + Piarrow_forwardTPP is also utilized in transketolase reactions in the PPP. Give a mechanism for theTPP-dependent reaction between Xylulose-5-phosphate and Ribose-5-Phosphate toyield Glyceraldehyde-3-phosphate and Sedoheptulose-7-Phosphate.arrow_forward
 BiochemistryBiochemistryISBN:9781319114671Author:Lubert Stryer, Jeremy M. Berg, John L. Tymoczko, Gregory J. Gatto Jr.Publisher:W. H. Freeman
 Lehninger Principles of BiochemistryBiochemistryISBN:9781464126116Author:David L. Nelson, Michael M. CoxPublisher:W. H. Freeman
 Fundamentals of Biochemistry: Life at the Molecul...BiochemistryISBN:9781118918401Author:Donald Voet, Judith G. Voet, Charlotte W. PrattPublisher:WILEY
 BiochemistryBiochemistryISBN:9781305961135Author:Mary K. Campbell, Shawn O. Farrell, Owen M. McDougalPublisher:Cengage Learning
 BiochemistryBiochemistryISBN:9781305577206Author:Reginald H. Garrett, Charles M. GrishamPublisher:Cengage Learning
 Fundamentals of General, Organic, and Biological ...BiochemistryISBN:9780134015187Author:John E. McMurry, David S. Ballantine, Carl A. Hoeger, Virginia E. PetersonPublisher:PEARSON