Concept explainers
a)
To determine: The value of
Introduction: Control charts used to determine whether the process is under control or not. Attributes and variables are the factors under the control charts.
a)
Answer to Problem 10P
The value of
Explanation of Solution
Given information:
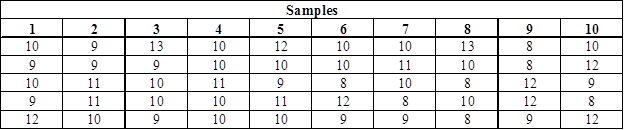
The following information is given:
Determine
The standard deviation of the sample means denoted by
Here,
σ refers to process standard deviation
n refers to the sample size.
The given values are
The standard deviation of the sample means
b)
To determine: The control limits for the mean chart if the value of z is 3.
Introduction: Control charts used to determine whether the process is under control or not. Attributes and variables are the factors under the control charts.
b)
Answer to Problem 10P
The UCL value of
Explanation of Solution
Given information:
The following information is given:
Sample size is given as 5 and process standard deviation is given as 1.36.
Determine the control limits for the mean chart if the value of z is 3:
Formulae to calculate control limits:
Here,
The value of
the standard deviation of the mean
Calculate the average for each sample:
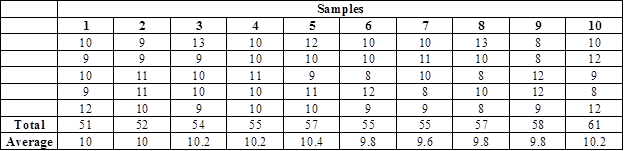
Working note:
Average for sample #1:
It is calculated by dividing the total of sample #1 and sample size.
Note: The same continues for all the samples.
Calculate the value of
It is calculated by dividing the sum of average of all the samples and the number of samples. Hence, the value of
Substitute the values in equation (1)to determine the value of UCL as follows:
Hence, the UCL value is 11.83.
Substitute the values in equation (2) to determine the value of LCL as follows:
Hence, the LCL value is 8.17.
c)
To determine: The control limits for the range chart.
Introduction: Control charts used to determine whether the process is under control or not. Attributes and variables are the factors under the control charts.
c)
Answer to Problem 10P
The UCL value of R-chart is 6.9795 and the LCL value is 0.
Explanation of Solution
Given information:
The following information is given:
Sample size is given as 5 and process standard deviation is given as 1.36.
Determine the control limits for the mean chart if the value of z is 3:
Formulae to calculate control limits:
Here,
Substitute the values in equation (3) to determine the value of UCL as follows:
Hence, the UCL value is 6.9795.
Substitute the values in equation (4) to determine the value of LCL as follows:
Hence, the LCL value is 0.
d)
To determine: Whether the process is in control.
Introduction: Control charts used to determine whether the process is under control or not. Attributes and variables are the factors under the control charts.
d)
Answer to Problem 10P
The process is in statistical control.
Explanation of Solution
Given information:
The following information is given:
Sample size is given as 5 and process standard deviation is given as 1.36.
Plot the sample mean values in the
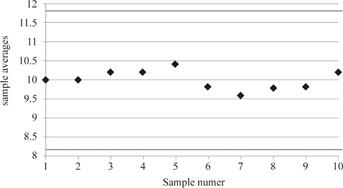
Plot the sample mean values in theR-control chart where
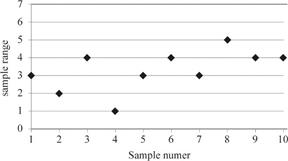
The sample range values lie well within the upper control limit and lower control limits.
The process is in statistical control.
Want to see more full solutions like this?
Chapter 6 Solutions
Pearson eText Principles of Operations Management: Sustainability and Supply Chain Management -- Instant Access (Pearson+)


- Agree or disagree with the post When you get an insulting offer, the best thing to do is stay calm and professional. Try not to take it personally or react out of anger. Instead, ask questions to understand why the offer was so low. This helps you get a better idea of what the other person is thinking. After that, you can respond with a counteroffer that shows your value. Use simple facts like your skills, experience, and what others in your field are getting paid to back up your request. If the person still refuses to offer something fair, it’s okay to politely say no and walk away. Standing up for yourself in a respectful way shows confidence and helps others take you seriously. Agree or disagree with the postarrow_forwardRegarding perceptions that can occur when negotiating in different places and at different times, the continuation norm in e-negotiations is best described as _____. Group of answer choices A. negotiators' beliefs that negotiations are worth continuing B. the act of thinking about how things might have turned out differently C. the tendency for e-communicators to ascribe diabolical intentions to the other party D. the tendency for negotiators to behave as if they are communicating synchronously when in fact they are notarrow_forwardIn any discussion or meeting, there is a tendency for a minority of people to do most of the talking. A key determinant of who dominates the conversation is _____. Group of answer choices A. their status within the group B. their network of social connections C. their gender D. their agearrow_forward
- With regard to intergenerational negotiation, the _____ generation has vast numbers of relationships but few of them are deep. They spend more time communicating virtually than face-to-face. Their personal and work networks are vital to their on-the-fly learning and problem-solving skills. Armed with tools for working anywhere at any time, this generation puts more value in leading a balanced life and flexibility with their work and life demands. Group of answer choices A. mature B. boomer C. millennial D. Generation Xarrow_forwardIf a negotiator has less power than the counterparty and an unattractive BATNA, which communication medium might help the less-powerful negotiator claim more resources?arrow_forwardCould you help explain what the foundations of faith are? What are their strategies?arrow_forward
- Hi! Can you guys help me with this? Thank you! Please write-up summarizing the core message of the movie/documentary and the connection to the course material The documentary is Poisoned: The Dirty Truth About Your Food directed by Stephanie Soechtig from Netflix. * Here are the course material: Global Logistics Global Transportation; Global Inventory Management Global Operation Global Market Channels Purchasing Stategies: Outsourcing; Offshoring; Nearshoring; Multi-sourcing & Co-sourcing Make or Buy decisions Global Supply Chain Infrastructure: Transportation Infrastructure; Communication Infrastructure; Utilities Infrastructure; Technology Infrastructure Supply Chain Risks: • Supply Risks – disruption of supply, inventory and schedules. • Operational Risks – breakdown of operations, changes in technologies. • Demand Risks – variations in demand.• Security Risks – theft, sabotage, terrorism, counterfeiting.• Macro Risks – economic shifts, recession, wage hikes, varying…arrow_forwardHi! Can you guys help me with this? Thank you! Please write-up summarizing the core message of the movie/documentary and the connection to the course material The documentary is American Factory by Steven Bognar & Julia Reichert from Netflix * Here the course material: Global Logistics Global Transportation; Global Inventory Management Global Operation Global Market Channels Purchasing Stategies: Outsourcing; Offshoring; Nearshoring; Multi-sourcing & Co-sourcing Make or Buy decsions Global Supply Chain Infrastructure: Transportation Infrastructure; Communication Infrastructure; Utilities Infrastructure; Technology Infrastructure Supply Chain Risks: • Supply Risks – disruption of supply, inventory and schedules. • Operational Risks – breakdown of operations, changes in technologies. • Demand Risks – variations in demand.• Security Risks – theft, sabotage, terrorism, counterfeiting.• Macro Risks – economic shifts, recession, wage hikes, varying exchangerates.• Policy Risks –…arrow_forward1) View the video Alton Bridge (12.16 mins, Ctrl + Click on the link), and please answer the following questions: https://meida.gaspar.mheducation.com/GASPARPlayer/play.html?id=24qHEm8aNZExFciJtZQbqli a) According to the video, what are the various steps involved in managing projects? b) What were the different phases of the Alton Bridge project? c) What are the two widely used scheduling techniques, and under what phase of the Alton Bridge project are they discussed? Note: As a rough guideline, please try to keep the written submission to a paragraph or so for each of the questions. 2) The following is a table of activities associated with a mining project at Lunar Industries, their durations, and what activities each must precede: Activity Duration (weeks) Precedes A (start) 1 B, C B 1 E C 4 F E 2 F F (end) 2 - The AOM project diagram is as given below: a) What is the critical path (list all activities in the…arrow_forward
- 1) View the video Alton Bridge (12.16 mins, Ctrl + Click on the link), and please answer the following questions: a) According to the video, what are the various steps involved in managing projects? b) What were the different phases of the Alton Bridge project? c) What are the two widely used scheduling techniques, and under what phase of the Alton Bridge project are they discussed? Note: As a rough guideline, please try to keep the written submission to a paragraph or so for each of the questions. 2) The following is a table of activities associated with a mining project at Lunar Industries, their durations, and what activities each must precede: Activity Duration (weeks) Precedes A (start) 1 B, C B 1 E C 4 F E 2 F F (end) 2 - The AOM project diagram is as given below:arrow_forwardWith all the problems companies are currently facing, why do so many choose to expand into international markets? What are the advantages of expanding beyond the domestic market?arrow_forwardPerform resource leveling. Assume that each task can be performed independently of the other tasks.arrow_forward
 Practical Management ScienceOperations ManagementISBN:9781337406659Author:WINSTON, Wayne L.Publisher:Cengage,
 Foundations of Business (MindTap Course List)MarketingISBN:9781337386920Author:William M. Pride, Robert J. Hughes, Jack R. KapoorPublisher:Cengage Learning
 Foundations of Business - Standalone book (MindTa...MarketingISBN:9781285193946Author:William M. Pride, Robert J. Hughes, Jack R. KapoorPublisher:Cengage Learning