Concept explainers
a)
To determine: The control limits for the mean and range chart and the overall means
Introduction: Control charts used to determine whether the process is under control or not. Attributes and variables are the factors under the control charts.
a)
Answer to Problem 11P
Hence, the UCL for
Explanation of Solution
Given information:
The following information is given:
| Sample | Sample mean (in.) | Range (in.) |
| 1 | 10.002 | 0.011 |
| 2 | 10.002 | 0.014 |
| 3 | 9.991 | 0.007 |
| 4 | 10.006 | 0.022 |
| 5 | 9.997 | 0.013 |
| 6 | 9.999 | 0.012 |
| 7 | 10.001 | 0.008 |
| 8 | 10.005 | 0.013 |
| 9 | 9.995 | 0.004 |
| 10 | 10.001 | 0.011 |
| 11 | 10.001 | 0.014 |
| 12 | 10.006 | 0.009 |
Twelve samples that contain five parts each were taken.
Calculate the average for sample and range:
| Sample | Sample mean (in.) | Range (in.) |
| 1 | 10.002 | 0.011 |
| 2 | 10.002 | 0.014 |
| 3 | 9.991 | 0.007 |
| 4 | 10.006 | 0.022 |
| 5 | 9.997 | 0.013 |
| 6 | 9.999 | 0.012 |
| 7 | 10.001 | 0.008 |
| 8 | 10.005 | 0.013 |
| 9 | 9.995 | 0.004 |
| 10 | 10.001 | 0.011 |
| 11 | 10.001 | 0.014 |
| 12 | 10.006 | 0.009 |
| Total | 120.006 | 0.138 |
| Average | 10.0005 | 0.0115 |
Working note:
Average for sample:
It is calculated by dividing the total of sample and number of samples. Hence, the value of
Average for range:
It is calculated by dividing the total of range and number of samples. Hence, the value of
Determine the UCL and LCL for mean:
Formulae to calculate control limits:
Here, the overall mean
Substitute the values in equation (1) to determine the value of UCL as follows:
Hence, the UCL value is 10.00714.
Substitute the values in equation (2) to determine the value of LCL as follows:
Hence, the LCL value is 9.993865.
Therefore for the
Determine the UCL and LCL for range:
Formulae to calculate control limits:
Here,
The average range is
Substitute the values in equation (3) to determine the value of UCL as follows:
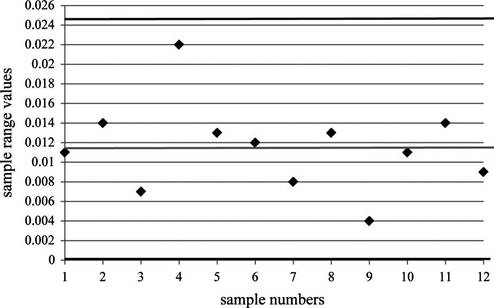
Hence, the UCL value is 0.024323.
Substitute the values in equation (4) to determine the value of LCL as follows:
Hence, the LCL value is 0.
Therefore, for the R-chart, the upper control limit is
b)
To plot: The values of sample means and ranges in the chart.
Introduction: Control charts used to determine whether the process is under control or not. Attributes and variables are the factors under the control charts.
b)
Answer to Problem 11P
Control chart has been plotted for sample means and ranges.
Explanation of Solution
Given information:
The following information is given:
| Sample | Sample mean (in.) | Range (in.) |
| 1 | 10.002 | 0.011 |
| 2 | 10.002 | 0.014 |
| 3 | 9.991 | 0.007 |
| 4 | 10.006 | 0.022 |
| 5 | 9.997 | 0.013 |
| 6 | 9.999 | 0.012 |
| 7 | 10.001 | 0.008 |
| 8 | 10.005 | 0.013 |
| 9 | 9.995 | 0.004 |
| 10 | 10.001 | 0.011 |
| 11 | 10.001 | 0.014 |
| 12 | 10.006 | 0.009 |
Twelve samples that contain five parts each were taken.
Plot the sample mean values in the
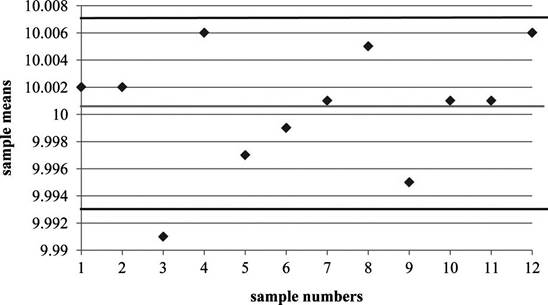
Note: Observe that sample 3 mean value is lower than the
Plot the sample mean values in theR-control chart where
c)
To determine: Whether the process is in control
Introduction: Control charts used to determine whether the process is under control or not. Attributes and variables are the factors under the control charts.
c)
Answer to Problem 11P
Process is out of control during sample #3 in
Explanation of Solution
Given information:
The following information is given:
| Sample | Sample mean (in.) | Range (in.) |
| 1 | 10.002 | 0.011 |
| 2 | 10.002 | 0.014 |
| 3 | 9.991 | 0.007 |
| 4 | 10.006 | 0.022 |
| 5 | 9.997 | 0.013 |
| 6 | 9.999 | 0.012 |
| 7 | 10.001 | 0.008 |
| 8 | 10.005 | 0.013 |
| 9 | 9.995 | 0.004 |
| 10 | 10.001 | 0.011 |
| 11 | 10.001 | 0.014 |
| 12 | 10.006 | 0.009 |
Twelve samples that contain five parts each were taken.
Determine whether the process is in control:
Since, the mean for sample #3 is outside the control limits of the
d)
To determine: Why the process is not in control
Introduction: Control charts used to determine whether the process is under control or not. Attributes and variables are the factors under the control charts.
d)
Explanation of Solution
Given information:
The following information is given:
| Sample | Sample mean (in.) | Range (in.) |
| 1 | 10.002 | 0.011 |
| 2 | 10.002 | 0.014 |
| 3 | 9.991 | 0.007 |
| 4 | 10.006 | 0.022 |
| 5 | 9.997 | 0.013 |
| 6 | 9.999 | 0.012 |
| 7 | 10.001 | 0.008 |
| 8 | 10.005 | 0.013 |
| 9 | 9.995 | 0.004 |
| 10 | 10.001 | 0.011 |
| 11 | 10.001 | 0.014 |
| 12 | 10.006 | 0.009 |
Twelve samples that contain five parts each were taken.
Determine why the process is not in control:
Further investigations are necessary to check whether the mean value of sample #3 is a freak incident outside the three sigma limits (which has a 0.27% probability). Perhaps 12 more samples can be drawn and examined whether such an incident occurs again. In case it happens again, the process needs to be examined in detail.
Want to see more full solutions like this?
Chapter 6 Solutions
Pearson eText Principles of Operations Management: Sustainability and Supply Chain Management -- Instant Access (Pearson+)


- I am currently working as a Sub Assistant Manager at Advance Personal Care Limited (APCL), a concern of Pran Group. I hold a Bachelor of Pharmacy (Professional) degree. I recently came across a job posting on BD Jobs for a position in Project Management within Quality Operations. I want to apply for this role and need to update my CV accordingly. Could you please guide me on what key information, achievements, and skills I should add or highlight in my CV to align with this new role? Note that i have 8 months experience on this role. Please don't use Ai answering this question. I will rate you positive if you do so.arrow_forwardWhat are the three main concepts of understanding in Operations Management?arrow_forwardNeed help please not sure where to start or how to write it.arrow_forward
- Need help please not sure where to start or how to write it.arrow_forwardSIPOC Process Supplier Machines Quality Group Leader Double Output Customers Inputs Solutions End of batch Inspection verification Scrap evaluation Sampling Verification Batch complete Evaluation Completed Quality Group Leader Samplings verified Quality Samplings verified Quality Barcode programed Mechanic Parameters registered Quality Line verified Quality Line Verified Quality Second verification Barcode Parameters Line Inspection Second Line Inspection Lot and Expiration Date Quality Quality Mechanic Mechanic Quality Machines Quality Group Leader Quality Quality Quality Batch Verification Process complete Revision Review Sampling Verification Barcode Scanner Machine Parameters Line Clearance Line Clearance Machine Remove Lot Status Verification Close floor Final MFG Review Final QA Review Close Batch Machine removed Lot verified Floor closed MFG Reviewed Process reviewed Batch closed Mechanic Group Leader Quality Quality Quality Group Leaderarrow_forwardAn assessment of gender leadership and corporate culture.Kindly provide the following, citing it using in-text referencing: • A thorough exploration of gender dynamics and concepts.• Creating a clear plan to address gender bias and promote inclusive leadership.• An examination of female leadership dynamics and their impact on performance. • Comprehensive justification behind the proposal.arrow_forward
- Assessment of Strategic Leadership and Global Context Provide the below in detail:· A comprehensive analysis of the current strategy,· Develop a new comprehensive strategic leadership framework that tackles the challenges of leading a global company while balancing global standards and responding to local context and challenges.· Justify a framework by drawing on and applying relevant theories of strategic leadership and global management.· It needs substantial depth and detail.· Conduct a critical evaluation of strategic leadership in a global context.arrow_forwardAssessing Leadership Ethics and Cross-cultural DiversityProvide the below with in-cite text referencing:- Investigate ethical issues and how they influence diversity and cross-cultural leadership.• Develop an ethical decision-making model that addresses cross-cultural concerns in emerging markets, such as Africa.· Conduct comprehensive analysis and modelling if necessary.- Provide a thorough ethical analysis that considers cross-cultural issues.· Careful evaluation of potential outcomes.- The proposed ethical decision-making technique is both novel and defendable.· Promoting diversity and recognising cross-cultural differences.arrow_forwardNeed help, have no idea where to start and love help upon a paper idea with no AI and soemthing original please.arrow_forward
- About the Assignment In this course, you learned how a business chooses a positioning strategy in the marketplace and focuses on these areas by evaluating management's use of production types, creating effective productivity, and analyzing the competitiveness of production. Now you will choose a retail organization and propose a positioning marketing strategy that analyzes the organizational management decisions related to any competitiveness of cost, quality, flexibility, speed, innovation, and/or service. Prompt Choose an organization that focuses on one of these areas in the market: competitiveness of cost, quality, flexibility, speed, innovation, and/or service. An example would be choosing ALDI or LIDL. Their cost marketing positioning strategy is providing customers with international goods for a lower price and, in turn, saving business fees by not providing bagging products for free. (This is just an example. Do not use this example for your project.) Use the following steps…arrow_forwardCan you guys help me with this? Thank you! The project is Terminal 1 at JFK International Airport Here's what need to do: Time Content: What was the estimated time of the project; what was the final time (or the estimated date) of the project; what are the major contributing factors for the disparity? (Please make sure all the information here can be present around 2 minutes) Risk management content: Discuss a major risk management event that affected the project. while researching if any team member finds an interesting risk management event *Include sources that you have the information when go over these 2 parts above.arrow_forwardI only need help with part C. Please and thank you :) ANSWERED: Gracie recorded the following times assembling a watch. Performance rating given is 95%. A) Average time of Gracie for the Operation? (round to three decimal places) ANSWER=0.107 B) normal time for this operation? (round to three decimal places) ANSWER=0.102 C) HELP PLEASE. "For a given personal allowance of 8% the standard time for the operation is how many minutes?" (round your answer to three decimal places)arrow_forward
 Practical Management ScienceOperations ManagementISBN:9781337406659Author:WINSTON, Wayne L.Publisher:Cengage,
 Foundations of Business (MindTap Course List)MarketingISBN:9781337386920Author:William M. Pride, Robert J. Hughes, Jack R. KapoorPublisher:Cengage Learning
 Foundations of Business - Standalone book (MindTa...MarketingISBN:9781285193946Author:William M. Pride, Robert J. Hughes, Jack R. KapoorPublisher:Cengage Learning