
Concept explainers
Videos
To determine all the combination of T-shirt and dress shirt one can buy.
Explanation of Solution
Given:
$100 gift certificate
T-shirts for $15 and dress shirts for $22
Spend no more than the amount of the gift certificate
Want to leave at most $10 of the gift certificate unspent
Need at least one dress shirt
Calculation for graph:
Let
Each T-shirt cost $15 so cost of T-shirts is $
Each dress shirts cost $22 so cost of dress shirts is $
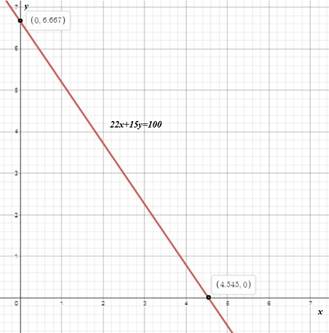
Total cost is
Want to spend no more than $100,
So,
So, the boundary line expression is,
Substituting
| Values of y | Value of x |
| 6.7 | 0 |
Substituting
| Values of x | Value of y |
| 4.5 | 0 |
Now plotting the graph,
Graph I:
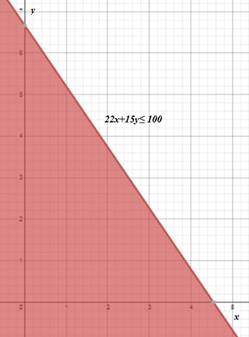
Solving the inequality for
Since, the expression is having
Graph II:
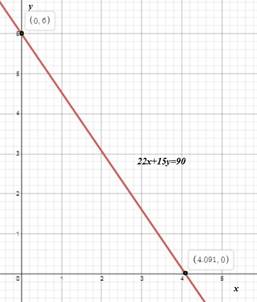
Want to leave at most $10 of the gift certificate unspent which means
Therefore, expression is,
So, the boundary line expression is,
Substituting
| Values of y | Value of x |
| 6 | 0 |
Substituting
| Values of x | Value of y |
| 4.1 | 0 |
Now plotting the graph,
Graph III:
Solving the inequality for
Since, the expression is having
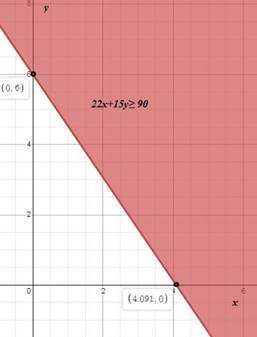
Need at least one dress shirt that is,
The boundary line of this inequality is
So the final graphical solution of the inequality is,
Graph IV:
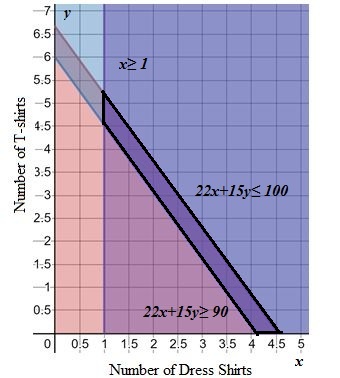
So, the deep purple area with black border represents the all possible combination of T-shirt and dress shirt one can buy.
Interpretation:
Therefore, deep purple area with black border represents the all possible combination of T-shirt and dress shirt one can buy.
Chapter 6 Solutions
EP ALGEBRA 1-ETEXT ACCESS
Additional Math Textbook Solutions
A Problem Solving Approach To Mathematics For Elementary School Teachers (13th Edition)
Intro Stats, Books a la Carte Edition (5th Edition)
Pre-Algebra Student Edition
Algebra and Trigonometry (6th Edition)
Basic Business Statistics, Student Value Edition


- Write an equation for the function shown. You may assume all intercepts and asymptotes are on integers. The blue dashed lines are the asymptotes. 10 9- 8- 7 6 5 4- 3- 2 4 5 15-14-13-12-11-10 -9 -8 -7 -6 -5 -4 -3 -2 1 1 2 3 -1 -2 -3 -4 1 -5 -6- -7 -8- -9 -10+ 60 7 8 9 10 11 12 13 14 15arrow_forwardUse the graph of the polynomial function of degree 5 to identify zeros and multiplicity. Order your zeros from least to greatest. -6 3 6+ 5 4 3 2 1 2 -1 -2 -3 -4 -5 3 4 6 Zero at with multiplicity Zero at with multiplicity Zero at with multiplicityarrow_forwardUse the graph to identify zeros and multiplicity. Order your zeros from least to greatest. 6 5 4 -6-5-4-3-2 3 21 2 1 2 4 5 ૪ 345 Zero at with multiplicity Zero at with multiplicity Zero at with multiplicity Zero at with multiplicity པ་arrow_forward
- Use the graph to write the formula for a polynomial function of least degree. -5 + 4 3 ♡ 2 12 1 f(x) -1 -1 f(x) 2 3. + -3 12 -5+ + xarrow_forwardUse the graph to identify zeros and multiplicity. Order your zeros from least to greatest. 6 -6-5-4-3-2-1 -1 -2 3 -4 4 5 6 a Zero at with multiplicity Zero at with multiplicity Zero at with multiplicity Zero at with multiplicityarrow_forwardUse the graph to write the formula for a polynomial function of least degree. 5 4 3 -5 -x 1 f(x) -5 -4 -1 1 2 3 4 -1 -2 -3 -4 -5 f(x) =arrow_forward
- Write the equation for the graphed function. -8 ง -6-5 + 5 4 3 2 1 -3 -2 -1 -1 -2 4 5 6 6 -8- f(x) 7 8arrow_forwardWrite the equation for the graphed function. 8+ 7 -8 ง A -6-5 + 6 5 4 3 -2 -1 2 1 -1 3 2 3 + -2 -3 -4 -5 16 -7 -8+ f(x) = ST 0 7 8arrow_forwardThe following is the graph of the function f. 48- 44 40 36 32 28 24 20 16 12 8 4 -4 -3 -1 -4 -8 -12 -16 -20 -24 -28 -32 -36 -40 -44 -48+ Estimate the intervals where f is increasing or decreasing. Increasing: Decreasing: Estimate the point at which the graph of ƒ has a local maximum or a local minimum. Local maximum: Local minimum:arrow_forward
- For the following exercise, find the domain and range of the function below using interval notation. 10+ 9 8 7 6 5 4 3 2 1 10 -9 -8 -7 -6 -5 -4 -3 -2 -1 2 34 5 6 7 8 9 10 -1 -2 Domain: Range: -4 -5 -6 -7- 67% 9 -8 -9 -10-arrow_forward1. Given that h(t) = -5t + 3 t². A tangent line H to the function h(t) passes through the point (-7, B). a. Determine the value of ẞ. b. Derive an expression to represent the gradient of the tangent line H that is passing through the point (-7. B). c. Hence, derive the straight-line equation of the tangent line H 2. The function p(q) has factors of (q − 3) (2q + 5) (q) for the interval -3≤ q≤ 4. a. Derive an expression for the function p(q). b. Determine the stationary point(s) of the function p(q) c. Classify the stationary point(s) from part b. above. d. Identify the local maximum of the function p(q). e. Identify the global minimum for the function p(q). 3. Given that m(q) = -3e-24-169 +9 (-39-7)(-In (30-755 a. State all the possible rules that should be used to differentiate the function m(q). Next to the rule that has been stated, write the expression(s) of the function m(q) for which that rule will be applied. b. Determine the derivative of m(q)arrow_forwardSafari File Edit View History Bookmarks Window Help Ο Ω OV O mA 0 mW ర Fri Apr 4 1 222 tv A F9 F10 DII 4 F6 F7 F8 7 29 8 00 W E R T Y U S D பட 9 O G H J K E F11 + 11 F12 O P } [arrow_forward
 Algebra and Trigonometry (6th Edition)AlgebraISBN:9780134463216Author:Robert F. BlitzerPublisher:PEARSON
 Contemporary Abstract AlgebraAlgebraISBN:9781305657960Author:Joseph GallianPublisher:Cengage Learning
 Linear Algebra: A Modern IntroductionAlgebraISBN:9781285463247Author:David PoolePublisher:Cengage Learning
 Algebra And Trigonometry (11th Edition)AlgebraISBN:9780135163078Author:Michael SullivanPublisher:PEARSON
 Introduction to Linear Algebra, Fifth EditionAlgebraISBN:9780980232776Author:Gilbert StrangPublisher:Wellesley-Cambridge Press
 College Algebra (Collegiate Math)AlgebraISBN:9780077836344Author:Julie Miller, Donna GerkenPublisher:McGraw-Hill Education