
Videos
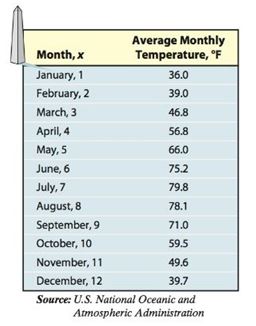
Monthly Temperature The data below represent the average monthly temperatures for Washington, D.C.
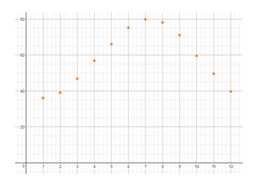
(a) Draw a
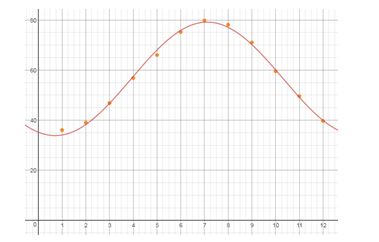
(b) Find a sinusoidal function of the for that models the data.
(c) Draw the sinusoidal function found in part on the scatter diagram.
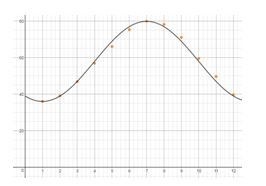
(d) Use a graphing utility to find the sinusoidal function of best fit.
(e) Graph the sinusoidal function of best fit on a scatter diagram of the data.
To find:
a. Draw a scatter diagram of the data.
Answer to Problem 30AYU
a.
Explanation of Solution
Given:
Calculation:
a. Draw a scatter diagram of the data.
To find:
b. Find a sinusoidal function of the form that models the data.
Answer to Problem 30AYU
b.
Explanation of Solution
Given:
Calculation:
b. Find a sinusoidal function of the form that models the data.
Determine , the amplitude of the function.
Determine , the vertical shift of the function.
Determine , It is easier to find the horizontal stretch factor first. Since the period of the function is . Because . Therefore .
Now superimpose the graph of on the scatter diagram. See Figure, where it is clear that the graph still needs to be shifted horizontally.
Determine the horizontal shift of the function by using the period of the data. we must shift the graph of the function.
At ,
To find:
c. Draw the sinusoidal function found in part (b) on the scatter diagram.
Answer to Problem 30AYU
c.
Explanation of Solution
Given:
Calculation:
c. Draw the sinusoidal function found in part (b) on the scatter diagram.
To find:
d. Use a graphing utility to find the sinusoidal function of best fit.
Answer to Problem 30AYU
Solution:
d.
Explanation of Solution
Given:
Calculation:
d. Use a graphing utility to find the sinusoidal function of best fit.
To find:
e. Graph the sinusoidal function of best fit on a scatter diagram of the data.
Answer to Problem 30AYU
e.
Explanation of Solution
Given:
Calculation:
e. Graph the sinusoidal function of best fit on a scatter diagram of the data.
Chapter 6 Solutions
Precalculus Enhanced with Graphing Utilities
Additional Math Textbook Solutions
Calculus: Early Transcendentals (2nd Edition)
University Calculus: Early Transcendentals (4th Edition)
Algebra and Trigonometry (6th Edition)
College Algebra with Modeling & Visualization (5th Edition)
Basic Business Statistics, Student Value Edition
A Problem Solving Approach To Mathematics For Elementary School Teachers (13th Edition)


- 4. Verify that V X (aẢ) = (Va) XẢ + aV X Ả where Ả = xyz(x + y + 2) A and a = 3xy + 4zx by carrying out the detailed differentiations.arrow_forward3. For each of the arrow or quiver graphs shown below, determine analytically V°C and V X Č. From these analytical solutions, identify the extrema (+/-) and plot these points on the arrow graph. (a) C = −✰CosxSiny + ŷSinxCosy -π<ׂу<π Ty (b) C = −xSin2y + ŷCos2y x, y<π -π< (c) C = −xCosx + ŷSiny -π< x, y < πarrow_forward7.10 (B/C). A circular flat plate of diameter 305 mm and thickness 6.35 mm is clamped at the edges and subjected to a Uniform lateral pressure of 345 kN/m². Evaluate: (a) the central deflection, (b) the position and magnitude of the maximum radial stress. C6.1 x 10 m; 149.2 MN/m².] 100 200arrow_forward
- 3.15 (B). A beam ABCD is simply supported at B and C with ABCD=2m; BC 4 m. It carries a point load of 60 KN at the free end A, a Uniformly distributed load of 60 KN/m between B and C and an anticlockwise moment of 80 KN m in the plane of the beam applied at the free end D. Sketch and dimension the S.F. and B.M. diagrams, and determine the position and magnitude of the maximum bending moment. CEL.E.] CS.F. 60, 170, 70KN, B.M. 120, +120.1, +80 kNm, 120.1 kNm at 2.83 m to right of 8.7arrow_forward7.1 (A/B). A Uniform I-section beam has flanges 150 mm wide by 8 mm thick and a web 180 mm wide and 8 mm thick. At a certain section there is a shearing force of 120 KN. Draw a diagram to illustrate the distribution of shear stress across the section as a result of bending. What is the maximum shear stress? [86.7 MN/m².arrow_forward1. Let Ả = −2x + 3y+42, B = - - 7x +lý +22, and C = −1x + 2y + 42. Find (a) Ả X B (b) ẢX B°C c) →→ Ả B X C d) ẢB°C e) ẢX B XC.arrow_forward
- 3.13 (B). A beam ABC, 6 m long, is simply-supported at the left-hand end A and at B I'm from the right-hand end C. The beam is of weight 100 N/metre run. (a) Determine the reactions at A and B. (b) Construct to scales of 20 mm = 1 m and 20 mm = 100 N, the shearing-force diagram for the beam, indicating thereon the principal values. (c) Determine the magnitude and position of the maximum bending moment. (You may, if you so wish, deduce the answers from the shearing force diagram without constructing a full or partial bending-moment diagram.) [C.G.] C240 N, 360 N, 288 Nm, 2.4 m from A.]arrow_forward5. Using parentheses make sense of the expression V · VXVV · Å where Ả = Ã(x, y, z). Is the result a vector or a scaler?arrow_forward3.10 (A/B). A beam ABCDE is simply supported at A and D. It carries the following loading: a distributed load of 30 kN/m between A and B, a concentrated load of 20 KN at B, a concentrated load of 20 KN at C, a concentrated load of 10 KN at E; a distributed load of 60 kN/m between 0 and E. Span AB = 1.5 BC = CD = DE 1 m. Calculate the value of the reactions at A and D and hence draw the S.F. and B.M. diagrams. What are the magnitude and position of the maximum B.M. on the beam? [41.1, 113.9 KN, 28.15 kNm; 1.37 m from A.J m,arrow_forward
- 3.14 (B). A beam ABCD, 6 m long, is simply-supported at the right-hand end and at a point B Im from the left-hand end A. It carries a vertical load of 10 KN at A, a second concentrated load of 20 KN at C, 3 m from D, and a uniformly distributed load of 10 kN/m between C and D. Determine: (a) the values of the reactions at B and 0, (6) the position and magnitude of the maximum bending moment. [33 KN, 27 KN, 2.7 m from D, 36.45k Nm.]arrow_forward3.17 (B). A simply supported beam has a span of 6 m and carries a distributed load which varies in a linea manner from 30 kN/m at one support to 90 kN/m at the other support. Locate the point of maximum bendin moment and calculate the value of this maximum. Sketch the S.F. and B.M. diagrams. [U.L.] [3.25 m from l.h. end; 272 KN m 30. 90arrow_forward3.11 (B). A beam, 12 m long, is to be simply supported at 2m from each end and to carry a U.d.l of 30kN/m together with a 30 KN point load at the right-hand end. For ease of transportation the beam is to be jointed in two places, one joint being Situated 5 m from the left-hand end. What load (to the nearest KN) must be applied to the left-hand end to ensure that there is no B.M. at the joint (i.e. the joint is to be a point of contraflexure)? What will then be the best position on the beam for the other joint? Determine the position and magnitude of the maximum B.M. present on the beam. [114 KN, 1.6 m from r.h. reaction; 4.7 m from 1.h. reaction; 43.35 KN m.]arrow_forward
 Calculus: Early TranscendentalsCalculusISBN:9781285741550Author:James StewartPublisher:Cengage Learning
 Thomas' Calculus (14th Edition)CalculusISBN:9780134438986Author:Joel R. Hass, Christopher E. Heil, Maurice D. WeirPublisher:PEARSON
 Calculus: Early Transcendentals (3rd Edition)CalculusISBN:9780134763644Author:William L. Briggs, Lyle Cochran, Bernard Gillett, Eric SchulzPublisher:PEARSON
 Calculus: Early TranscendentalsCalculusISBN:9781319050740Author:Jon Rogawski, Colin Adams, Robert FranzosaPublisher:W. H. Freeman
 Calculus: Early Transcendental FunctionsCalculusISBN:9781337552516Author:Ron Larson, Bruce H. EdwardsPublisher:Cengage Learning