Concept explainers
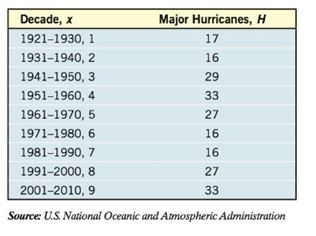
Hurricanes Hurricanes are categorized using the Saffir-Simpson Hurricane Scale, with winds 111-130 miles per hour (mph) corresponding to a category 3 hurricane, winds 131-155 mph corresponding to a category 4 hurricane, and winds in excess of 155 mph corresponding to a category 5 hurricane. The following data represent the number of major hurricanes in the Atlantic Basin (category 3, 4, or 5) each decade from 1921 to 2010.
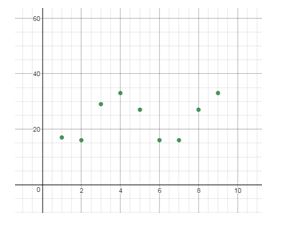
(a) Draw a
(b) Find a sinusoidal function of the form that models the data.
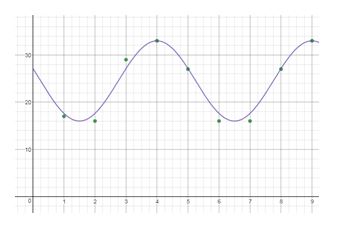
(c) Draw the sinusoidal function found in part on the scatter diagram.
(d) Use a graphing utility to find the sinusoidal function of best fit.
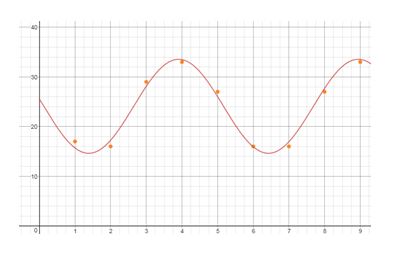
(e) Graph the sinusoidal function of best fit on a scatter diagram of the data.

To find:
a. Draw a scatter diagram of the data.
Answer to Problem 29AYU
a.

Explanation of Solution
Given:
Calculation:
a. Draw a scatter diagram of the data.

To find:
b. Find a sinusoidal function of the form that models the data.
Answer to Problem 29AYU
b.
Explanation of Solution
Given:
Calculation:
b. Find a sinusoidal function of the form that models the data.
Determine , the amplitude of the function.
Determine , the vertical shift of the function.
Determine , It is easier to find the horizontal stretch factor first. Since the temperatures repeat every 5 hurricanes, the period of the function is . Because . Therefore .
Now superimpose the graph of on the scatter diagram. See Figure, where it is clear that the graph still needs to be shifted horizontally.
Determine the horizontal shift of the function by using the period of the data. we must shift the graph of the function .
To find:
c. Draw the sinusoidal function found in part (b) on the scatter diagram.
Answer to Problem 29AYU
c.

Explanation of Solution
Given:
Calculation:
c. Draw the sinusoidal function found in part (b) on the scatter diagram.

To find:
d. Use a graphing utility to find the sinusoidal function of best fit.
Answer to Problem 29AYU
d.
Explanation of Solution
Given:
Calculation:
d. Use a graphing utility to find the sinusoidal function of best fit.
To find:
e. Graph the sinusoidal function of best fit on a scatter diagram of the data.
Answer to Problem 29AYU
e.

Explanation of Solution
Given:
Calculation:
e. Graph the sinusoidal function of best fit on a scatter diagram of the data.

Chapter 6 Solutions
Precalculus Enhanced with Graphing Utilities
Additional Math Textbook Solutions
Pre-Algebra Student Edition
Calculus: Early Transcendentals (2nd Edition)
Thinking Mathematically (6th Edition)
Elementary Statistics (13th Edition)
Elementary Statistics
Elementary Statistics: Picturing the World (7th Edition)
- A factorization A = PDP 1 is not unique. For A= 7 2 -4 1 1 1 5 0 2 1 one factorization is P = D= and P-1 30 = Use this information with D₁ = to find a matrix P₁ such that - -1 -2 0 3 1 - - 1 05 A-P,D,P P1 (Type an integer or simplified fraction for each matrix element.)arrow_forwardMatrix A is factored in the form PDP 1. Use the Diagonalization Theorem to find the eigenvalues of A and a basis for each eigenspace. 30 -1 - 1 0 -1 400 0 0 1 A= 3 4 3 0 1 3 040 3 1 3 0 0 4 1 0 0 003 -1 0 -1 Select the correct choice below and fill in the answer boxes to complete your choice. (Use a comma to separate vectors as needed.) A basis for the corresponding eigenspace is { A. There is one distinct eigenvalue, λ = B. In ascending order, the two distinct eigenvalues are λ₁ ... = and 2 = Bases for the corresponding eigenspaces are { and ( ), respectively. C. In ascending order, the three distinct eigenvalues are λ₁ = = 12/2 = and 3 = Bases for the corresponding eigenspaces are {}, }, and { respectively.arrow_forwardN Page 0.6. 0.4. 0.2- -0.2- -0.4- -6.6 -5 W 10arrow_forward
- Diagonalize the following matrix, if possible. 8 0 6 - 8 Select the correct choice below and, if necessary, fill in the answer box to complete your choice. 8 0 OA. For P= D= 0 3 6 0 B. For P = D= 0 -6 8 0 C. For P = D= 0 - 8 D. The matrix cannot be diagonalized.arrow_forwardCalculus lll May I please have the solutions for the following exercises? Thank youarrow_forwardCalculus lll May I please have the solution for the following question? Thank youarrow_forward
- Find three horizontal tangents between [0,10]arrow_forward4 In the integral dxf1dy (7)², make the change of variables x = ½(r− s), y = ½(r + s), and evaluate the integral. Hint: Find the limits on r and s by sketching the area of integration in the (x, y) plane along with the r and s axes, and then show that the same area can be covered by s from 0 to r and r from 0 to 1.arrow_forward7. What are all values of 0, for 0≤0<2л, where 2 sin² 0=-sin? - 5π 6 π (A) 0, л, and 6 7π (B) 0,л, 11π , and 6 6 π 3π π (C) 5π 2 2 3 , and π 3π 2π (D) 2' 2'3 , and 3 4元 3 1 די } I -2m 3 1 -3 บ 1 # 1 I 3# 3m 8. The graph of g is shown above. Which of the following is an expression for g(x)? (A) 1+ tan(x) (B) 1-tan (x) (C) 1-tan (2x) (D) 1-tan + X - 9. The function j is given by j(x)=2(sin x)(cos x)-cos x. Solve j(x) = 0 for values of x in the interval Quiz A: Topic 3.10 Trigonometric Equations and Inequalities Created by Bryan Passwaterarrow_forward
 Calculus: Early TranscendentalsCalculusISBN:9781285741550Author:James StewartPublisher:Cengage Learning
 Thomas' Calculus (14th Edition)CalculusISBN:9780134438986Author:Joel R. Hass, Christopher E. Heil, Maurice D. WeirPublisher:PEARSON
 Calculus: Early Transcendentals (3rd Edition)CalculusISBN:9780134763644Author:William L. Briggs, Lyle Cochran, Bernard Gillett, Eric SchulzPublisher:PEARSON
 Calculus: Early TranscendentalsCalculusISBN:9781319050740Author:Jon Rogawski, Colin Adams, Robert FranzosaPublisher:W. H. Freeman
 Calculus: Early Transcendental FunctionsCalculusISBN:9781337552516Author:Ron Larson, Bruce H. EdwardsPublisher:Cengage Learning


