
Videos
In Problems 17-40, graph each function. Be sure to label key points and show at least two cycles. Use the graph to determine the domain and the range of each function.
To find: Domain and range.
Answer to Problem 27AYU
Solution:
Domain is .
Range .
Explanation of Solution
Given:
Calculation:
The graph .
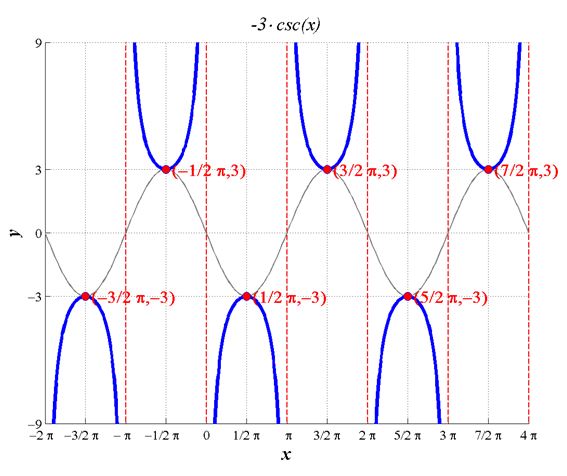
By the graph we determine that the domain of this function is the set of all real numbers where cosecant is defined, which excludes points where vertical asymptotes occur. Since this happens when . Therefore the domain is . To determine the range we take note of the value of , which will scale the underlying reciprocal sine function amplitude to 3. The given function will not enter into the space of the cosine (apart from its maxima and minima). Therefore the range is . This agrees with the graph provided.
Therefore the,
Domain is .
Range .
Chapter 6 Solutions
Precalculus Enhanced with Graphing Utilities
Additional Math Textbook Solutions
Calculus: Early Transcendentals (2nd Edition)
Elementary Statistics (13th Edition)
A Problem Solving Approach To Mathematics For Elementary School Teachers (13th Edition)
Elementary Statistics
A First Course in Probability (10th Edition)
Elementary Statistics: Picturing the World (7th Edition)


- Let V be the volume of the solid obtained by rotating about the y-axis the region bounded y = √16x and y V = Draw a diagram to explain your method. 15 10 5 y 15 10 5 y = Find V by slicing. 16 X О -15 -10 -5 5 10 15 О -15 -10 -5 5 10 15 15 10 y 15 10 5 y x -15 -10 -5 5 10 -15 -10 -5 5 10 15 10 X 15arrow_forwarda) let SSK : A->R be function and let c be acluster Point of A if lim S, (x) exists for each i=1, 2, .-,k then K i) lim Si (x)= lim fi (x) X->C 1=1 11), im π fi (x) = lim fi (x) YC il i=1 1) let f(x) = ) x² Sin (1/x), xe Q/{o} f(x) = { x² cos(\/x), x&Q Show that lim f(x)= 0 X = 0 c) Give an example of aset ASR, a cluster Point C of Aand two fun. & 9: AR st lim f(x)9(x) exsis bat limfex) does not exist X-Carrow_forward2. [-/4 Points] DETAILS MY NOTES SESSCALCET2 7.3.002. Let S be the solid obtained by rotating the region shown in the figure about the y-axis. (Assume a = 6 and b = 2.) ASK YOUR TEACHER 0 y = a sin(bx²) Sketch a typical approximating shell. y 6 4 2 x π/b y 2 1 x 0.5 1.0 1.5 0.2 0.4 0.6 0.8 1.0 -2 -1 -4arrow_forward
- The graph of f', the derivative of f, is shown in the graph below. If f(-9) = -5, what is the value of f(-1)? y 87 19 6 LO 5 4 3 1 Graph of f' x -10 -9 -8 -7 -6 -5 -4 -3 -2 -1 1 2 3 4 5 6 7 8 9 10 -1 -2 -3 -4 -5 -6 -7 -8 564%arrow_forwardLet f(x)=−7e^xsinxf'(x)=arrow_forwardFind dydx for y=tan(5x)/7e3x.dy/dx =arrow_forward
 Calculus: Early TranscendentalsCalculusISBN:9781285741550Author:James StewartPublisher:Cengage Learning
 Thomas' Calculus (14th Edition)CalculusISBN:9780134438986Author:Joel R. Hass, Christopher E. Heil, Maurice D. WeirPublisher:PEARSON
 Calculus: Early Transcendentals (3rd Edition)CalculusISBN:9780134763644Author:William L. Briggs, Lyle Cochran, Bernard Gillett, Eric SchulzPublisher:PEARSON
 Calculus: Early TranscendentalsCalculusISBN:9781319050740Author:Jon Rogawski, Colin Adams, Robert FranzosaPublisher:W. H. Freeman
 Calculus: Early Transcendental FunctionsCalculusISBN:9781337552516Author:Ron Larson, Bruce H. EdwardsPublisher:Cengage Learning