In Problems 39-47, construct a mathematical model in the form of a linear programming problem. Do not solve.
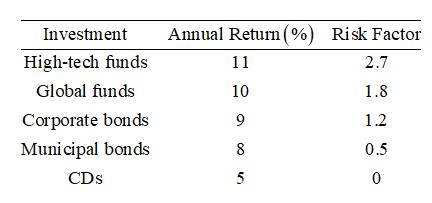
Investment strategy. An investor is planning to divide her investments among high-tech mutual funds, global mutual funds, corporate bonds, municipal bonds, and CDs. Each of these investments has an estimated annual return and a risk factor (see the table). The risk level for each choice is the product of its risk factor and the percentage of the total funds invested in that choice. The total risk level is the sum of the risk levels for all the investments. The investor wants at least
Want to see the full answer?
Check out a sample textbook solutionChapter 6 Solutions
FINITE MATHMATICS F/ BUSI...-ACCESS
Additional Math Textbook Solutions
Elementary Statistics (13th Edition)
Thinking Mathematically (6th Edition)
Basic Business Statistics, Student Value Edition
Elementary Statistics
Pre-Algebra Student Edition
- If during the following year it is predicted that each comedy skit will generate 30 thousand and each musical number 20 thousand, find the maximum income for the year. A television program director must schedule comedy skits and musical numbers for prime-time variety shows. Each comedy skit requires 2 hours of rehearsal time, costs 3000, and brings in 20,000 from the shows sponsors. Each musical number requires 1 hour of rehearsal time, costs 6000, and generates 12,000. If 250 hours are available for rehearsal and 600,000 is budgeted for comedy and music, how many segments of each type should be produced to maximize income? Find the maximum income.arrow_forward4. An investor is considering three types of investments: a high-risk venture into oil leases with a potential return of 15%, a medium-risk investment in bonds with a 9% return, and a relatively safe stock investment with a 5% return. He has $50,000 to invest. Because of the risk, he will limit his investment in oil leases and bonds to 30% (of the $50,000) and his investment in oil leases and stock to 50%. How much should he invest in each to maximize his return, assuming investment returns are as expected? (a) Define the variables. Be specific with descriptive words. x₁ = x₂ = x3 = (b) Clearly state the constraints (all inequalities) related to the feasible region. (c) State the objective function. 7arrow_forwardYou have $10,000 to invest, and three different funds from which to choose. The municipal bond fund has a 7% return, the local bank's CDs have an 8% return, and the high‐risk account has an expected (hoped‐for) 12% return. To minimize risk, you decide not to invest any more than $2,000 in the high‐risk account. For tax reasons, you need to invest at least three times as much in the municipal bonds as in the bank CDs. Assuming the year‐end yields are as expected, what are the optimal investment amounts? a. Choose the unknowns, i.e. variables. State what they are so you know exactly what you are looking for.b. Write your OPTIMIZATION EQUATION. c. Write the constraints as a system of inequalities, usually there are several.d. Graph the system and identify the feasibility region. e. Identify the corners of the feasibility region, which will be the ordered pairs that you test in your optimization equation.f. Calculate the value of the optimization equation using each of the ordered pairs…arrow_forward
- Formulate but do not solve the problem.The management of a private investment club has a fund of $200,000 earmarked for investment in stocks. To arrive at an acceptable overall level of risk, the stocks that management is considering have been classified into three categories: high-risk, medium-risk, and low-risk. Management estimates that high-risk stocks will have a rate of return of 14%/year; medium-risk stocks, 9%/year; and low-risk stocks, 6%/year. The investment in low-risk stocks is to be twice the sum of the investments in stocks of the other two categories. If the investment goal is to have an average rate of return of 9%/year on the total investment, determine how much the club should invest in each type of stock. (Assume that all the money available for investment is invested. Let x, y, and z denote the amount, in dollars, invested in high-, medium-, and low-risk stocks, respectively.) = 200,000 = z = .09(200,000)arrow_forwardHow do I solve the following: You are an investment manager for Simple Asset Management, a company that specializes in developing simple investment portfolios consisting of no more than three assets such as stocks, bonds, etc., for investors who like to keep things simple. One of your more popular investments is called the All World Fund and is composed of global stocks with good dividend yields. A client is interested in constructing a portfolio that consists of the All World Fund and the Treasury Index Fund, which consists of U.S. Treasury securities (government bonds). You calculate a 7.8% expected return on the All World Fund with a return standard deviation (a measure of risk) of 18.90%. The expected return of the Treasury Index Fund is 5.50% with a return standard deviation of 4.6%. To analyze the relationship between the two investments, you also calculate the covariance between the two of –12.4. Which graph below best represents the expected returns for the…arrow_forwardDataware is trying to determine whether to give a $10 rebate, cut the price $6, or have no price change on a software product. Currently, 40,000 units of the product are sold each week for $45 apiece. The variable cost of the product is $5. The most likely case appears to be that a $10 rebate will increase sales 30%, and half of all people will claim the rebate. For the price cut, the most likely case is that sales will increase 20%. a. Given all other assumptions, what increase in sales from the rebate would make the rebate and price cut equally desirable? b. Dataware does not really know the increase in sales that will result from a rebate or price cut. However, the company is sure that the rebate will increase sales by between 15% and 40% and that the price cut will increase sales by between 10% and 30%. Perform a sensitivity analysis that could be used to help determine Dataware’s best decision.arrow_forward
- Blair & Rosen, Inc. (B&R), is a brokerage firm that specializes in investment portfolios designed to meet the specific risk tolerances of its clients. A client who contacted B&R this past week has a maximum of $70,000 to invest. B&R's investment advisor decides to recommend a portfolio consisting of two investment funds: an Internet fund and a Blue Chip fund. The Internet fund has a projected annual return of 8%, whereas the Blue Chip fund has a projected annual return of 7%. The investment advisor requires that at most $45,000 of the client's funds should be invested in the Internet fund. B&R services include a risk rating for each investment alternative. The Internet fund, which is the more risky of the two investment alternatives, has a risk rating of 6 per thousand dollars invested. The Blue Chip fund has a risk rating of 4 per thousand dollars invested. For example, if $10,000 is invested in each of the two investment funds, B&R's risk rating for the portfolio would be 6(10) +…arrow_forwardMJ Logistics has decided to build a new warehouse to support its supply chain activities. They have the option of building either a large warehouse or a small one. Construction costs are $8 million for the large facility versus $3 million for the small facility. The profit (excluding construction cost) depends on the volume of work the company expects to contract for in the future. This is summarized in the following table (in millions of dollars): Large warehouse Small warehouse High Volume Low Volume $35 $20 $25 $15 The company believes that there is a 60% chance that the volume of demand will be high. Construct a decision tree to identify the best choice. Hint: Low demand volume probability is 40% and construction costs must be deducted from branch payoffs!arrow_forward5arrow_forward
- Roland's Barber Shop and Charley's Barber Shop are both located in the business district of a certain town. Roland estimates that if he raises the price of a haircut by $1, he will increase his market share by 6% if Charley raises his price by the same amount; he will decrease his market share by 1% if Charley holds his price at the same level; and he will decrease his market share by 2% if Charley lowers his price by $1. If Roland keeps his price the same, he will increase his market share by 4% if Charley raises his price by $1; he will keep the same market share if Charley holds the price at the same level; and he will decrease his market share by 3% if Charley lowers his price by $1. Finally, if Roland lowers the price he charges by $1, his market share will increase by 5% if Charley raises his prices by the same amount; he will increase his market share by 3% if Charley holds his price at the same level; and he will increase his market share by 2% if Charley lowers his price by…arrow_forwardSwain Athletic Gear (SAG) operates six retail outlets in a large Midwest city. One is in the center of the city on Cornwall Street and the others are scattered around the perimeter of the city. Management at SAG is concerned about declining sales and profitability of the Cornwall store and believes that outlet has been a drag on profits in recent years. The most recent income statement for the Cornwall store follows. SWAIN ATHLETIC GEAR Cornwall Street Store Income Statement For the Year Ending February 28 Sales revenue $ 12,300,000 Costs Cost of goods sold $ 5,289,000 Advertising 1,421,000 Store administrative salaries 975,000 Sales commissions 1,056,000 Leases and utilities 2,100,000 Allocated corporate support 1,622,000 Total costs $ 12,463,000 Net loss before tax benefit $ (163,000) Tax benefit at 25% (40,750) Net loss $ (122,250) The CFO at SAG has asked for your advice on closing the Cornwall Street store. If the Cornwall Street store is…arrow_forwardA financial manager has to invest $ 200000 in two options, one risky with a return of 20% and second less risky with a return of 10% per year. If the goal is to make $ 32000 at the end of the year what should be distribution of the money in both options.arrow_forward
- College Algebra (MindTap Course List)AlgebraISBN:9781305652231Author:R. David Gustafson, Jeff HughesPublisher:Cengage Learning