Concept explainers
Videos
Five
a. Use the data in Table A to place each point mutation as precisely as you can along the chromosome.
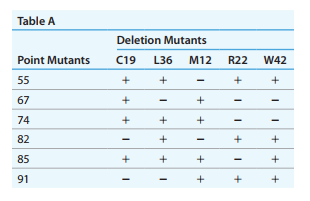
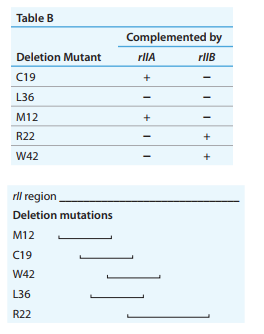
b. Use the complementation data in Table B to determine where the division between rIIA and rIIB is located on the rII region.
c. Based on the data and on your analysis, draw a complementation table for the five point mutants
d. Add mutant
Want to see the full answer?
Check out a sample textbook solution
Chapter 6 Solutions
Genetic Analysis: An Integrated Approach (2nd Edition)


- In the Holliday model for homologous recombination shown, the resolution steps can produce recombinant or nonrecombinantchromosomes. Explain how this can occur.arrow_forwardYou have two mutants of pQE. 1-CRYGD. One is 66 ng/uL and the other is 337 ng/uL. You need to add 1 ng to your competent NEB Express Iq cells. A. Can you accurately pipet the plasmid for each? Why or why not? B. How could you dilute the plasmid to obtain 50 uL of 0.5 ng/uL? C.How much of the new 0.5 ng/uL sample would you need to pipette for 1 ngarrow_forwardThe data below are from a DNAse-Seq experiment of chromosome 22. DNAse-seq is another method for measuring chromatin organization. In the experiment, regions of chromatin are digested with DNAse I and DNA is sequenced to determined to identify cleavage sites. See this short article for complete explanation. Which of the following statements are true based on the data below (select all that apply)? A. Region C appears to be an actively transcribed region in all tissue types except trophoblasts B. Region A could be an origin of replication for the chromosome C. Region B is highly associated with nucleosomes in BE2C and Natural KIller Cells D. The genes in the fetal kidney tissue are the least actively transcribed on chromosome 22. E. The data for each tissue must be from separate people to have such a variation in DNAse sensitivityarrow_forward
- An Hfrstrain that is a *b*c*d* e*f* g *h* is mated with an F strain that is a b e d e f gh. The mating is interrupted at 5 minutes interval, and the genotypes of the F recombinants are determined. The results obtained are tabulated in Table 2. Draw the map of the Hfrchromosome and indicate the position of the origin of transfer, the direction of the transfer and the minutes between genes. Table 2:Entry time of Hfr chromosome into recipient cell. Time a d e f h 5 10 15 20 25 30 35 40 45 50 55 60 65 70 75 80 85 + + + + + + + + + + + + + + + + + + + + + + + + + + + + + + + + +arrow_forward3) You have identified an interesting mutant in gene P. Using a Punnett square, demonstrate the cross you perform to determine if it is a dominant or recessive mutation compared to the WT gene P allele. Write the expected ratios for either scenario. 4) You have determined the mutation is dominant when compared to the WT allele. Briefly describe a technique you could use to determine if expression levels of gene P have been altered in this mutant. 5) You have determined the expression level of gene P has increased. What class/type of mutation would cause this?arrow_forwardAn Hfr strain that is hisE + and pheA + was conjugated to a strain that is hisE − and pheA −. The conjugation was interrupted at different times, and the percentage of recombinants for each gene was determined by streaking on media that lacked either histidine or phenylalanine. The following results were obtained: A. Determine the map distance (in minutes) between these twogenes.B. In a previous experiment, it was found that hisE is 4 minutesaway from pabB and that PheA is 17 minutes from pabB. Drawa genetic map showing the locations of all three genes.arrow_forward
- a. What are the linkage distances between m and r, between r and t, and between m and t?b. Determine the linkage order for the three genes.?c. What is the coefficient of coincidence (see Chapter 4) in this cross? What does it signify?arrow_forwardYou are attempting to genotype a series of cells at gene A through restriction enzyme digestion. You know that the wild type allele “A” has 2 restriction enzyme cutting sites, creating bands that are 100bp, 200bp, and 300bp. A mutation creating allele “a” removes one of these cutting sites, creating bands that are 100bp and 500bp. How many separate bands would you expect to see on a gel for a cell that is heterozygous Aa? please show work. thanksarrow_forwardColchicine is a chemical mutagen that inhibits the spindle formation and prevents anaphase, which retains the cell’s single restitution nucleus (doubled chromosome number). Suppose that an onion (2n=16) is subjected to three consecutive rounds of colchicine treatment, what will be the resulting chromosome number of the treated onion?arrow_forward
- Consider the following two wild type chromosomes: AB•CDEFGH I•JKLMN What kind of rearrangement is observed in the mutated chromosomes below? AB•CLMN I•JKDEFGH A. non-reciprocal translocation B. tandem duplication C. reciprocal translocation D. displaced duplication E. deletionarrow_forwardThe DNA of every individual in the pedigree shown in image B (below) has been sequenced at the causative locus, all the non-shaded individuals are wild type apart from III.1 and III.6. III.1 and III.6 have both been proven to have the causative allele for the condition but they do not exhibit any of the phenotypic signs or symptoms. Based on this pedigree, what is the level of penetrance for the condition? Please give your answer as a percentage to one decimal place, give the number only, no percentage symbol. Given the information above I calculate the level of penetrance seen in image B to be "Blank" 1 percent.arrow_forwardThe DNA of every individual in the pedigree shown in image B (below) has been sequenced at the causative locus, all the non- shaded individuals are wild type apart from III.1 and III.6. III.1 and III.6 have both been proven to have the causative allele for the condition but they do not exhibit any of the phenotypic signs or symptoms. Based on this pedigree, what is the level of penetrance for the condition? Please give your answer as a percentage to one decimal place, give the number only, no percentage symbol. ANSWER: Given the information above I calculate the level of penetrance seen in image B to be Blank 1 percent. A KEY Homozygous Homozygous Heterozygous Heterozygous Wild Type Male Female Male Female Male Note: Completely red symbol denotes an individual exhibiting the phenotype of interest CI || III IV V 1/4 1/2 1/2 1/2 1/2 Wild Type Female 1/4 1/2 Affected Known carrier Affected female Normal female Affected male Normal male D ●●●arrow_forward
 Human Anatomy & Physiology (11th Edition)BiologyISBN:9780134580999Author:Elaine N. Marieb, Katja N. HoehnPublisher:PEARSON
 Biology 2eBiologyISBN:9781947172517Author:Matthew Douglas, Jung Choi, Mary Ann ClarkPublisher:OpenStax
 Anatomy & PhysiologyBiologyISBN:9781259398629Author:McKinley, Michael P., O'loughlin, Valerie Dean, Bidle, Theresa StouterPublisher:Mcgraw Hill Education,
 Molecular Biology of the Cell (Sixth Edition)BiologyISBN:9780815344322Author:Bruce Alberts, Alexander D. Johnson, Julian Lewis, David Morgan, Martin Raff, Keith Roberts, Peter WalterPublisher:W. W. Norton & Company
 Laboratory Manual For Human Anatomy & PhysiologyBiologyISBN:9781260159363Author:Martin, Terry R., Prentice-craver, CynthiaPublisher:McGraw-Hill Publishing Co.
 Inquiry Into Life (16th Edition)BiologyISBN:9781260231700Author:Sylvia S. Mader, Michael WindelspechtPublisher:McGraw Hill Education