
Concept explainers
Videos
Changes in the Air To assess the impact of human activity on the carbon dioxide level in Earth’s atmosphere, it helps to take a long view. One useful data set comes from deep core samples of Antarctic ice. The oldest ice core that has been fully analyzed dates back a bit more than 400,000 years. Air bubbles trapped in the ice provide information about the gas content in Earth’s atmosphere at the time the ice formed. Combining ice core data with more recent direct measurements of atmospheric carbon dioxide—as in FIGURE 46.13—can help scientists put current changes in the atmospheric carbon dioxide into historical perspective.
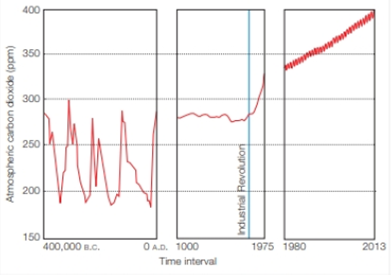
FIGURE 46.13 Changes in atmospheric carbon dioxide levels (in parts per million). Direct measurements began in 1980. Earlier data are based on ice cores.
What was the highest carbon dioxide level between 400,000 B.C. and 0 A.D.?
To determine: The highest carbon dioxide level between 400, 000 B.C. and 0 A.D.
Introduction: The carbon dioxide concentration is rising, and the present-day concentration is highest in 15 million years. It is more of as a result of human activities that contributed in increase in carbon dioxide level in the Earth’s atmosphere. The major contribution is by burning of fossil fuels that releases high amounts of carbon in the atmosphere. This impacts climate and ecosystems.
Answer to Problem 1DAA
Correct answer: The highest carbon dioxide level between 400, 000 B.C. and 0 A.D. is 300 ppm.
Explanation of Solution
Refer Fig. 46.13, “Changes in atmospheric carbon dioxide levels (in parts per million)”, in the textbook. The graphical representation shows the atmospheric carbon dioxide (ppm) measured from deep core samples of Antarctic ice. The air bubbles trapped in the ice gives information regarding the gas content in the Earth’s atmosphere at the time the ice was formed. The oldest ice sample analyzed dates back to more than 400, 000 years. According to the graphical data, the highest level of carbon dioxide between 400, 000 B.C. and 0 A.D was 300 ppm. There were many variations (highs and lows) in the levels during this period.
Want to see more full solutions like this?
Chapter 46 Solutions
Biology: The Unity and Diversity of Life (MindTap Course List)
Additional Science Textbook Solutions
Physics for Scientists and Engineers
Applications and Investigations in Earth Science (9th Edition)
Genetics: From Genes to Genomes
Microbiology Fundamentals: A Clinical Approach
Human Physiology: An Integrated Approach (8th Edition)


- 4.arrow_forward2arrow_forward1. 2. 3. Marine fish cells are hypotonic compared to their seawater environment; their cells lose water by osmosis and gain solutes. If you add heterotrophic respiration and autotrophic respiration together and then subtract that value from gross primary productivity, then you have a more refined estimate of ecosystem carbon storage than NEE. Differential heating due to the earth's tilt generates the global wind AND oceanic circulation patternsarrow_forward
- KD 200- 116- 66- Vec ATF6 (670) ATF6 (402) ATF6 (373) ATF6 (366) I I 45- 1 2 3 4 5 ATFG (360) (e/c) 9V ATFG (402) g ant- ATF anti-KDEL DAPI barrow_forwardWestern blot results: what information can you get? Presence of proteins of your interest Levels of protein expression Levels of protein activation (must use activation state-specific antibody) Decreased function of the ATM kinase in aging mice. A C57BL/6 female 6 month Con IR 20 month C57BL/6 male 6 month 28 month Con IR Con IR Con IR p-ATM (S1981) ATM P-p53 (ser18) Actinarrow_forwardDoes it show the level of proteins? What about the amount? Levels of protein activation? How can you tell? Does the thickness tell you anything? What about the number of the lines?arrow_forward
 Biology Today and Tomorrow without Physiology (Mi...BiologyISBN:9781305117396Author:Cecie Starr, Christine Evers, Lisa StarrPublisher:Cengage Learning
 Biology: The Unity and Diversity of Life (MindTap...BiologyISBN:9781305073951Author:Cecie Starr, Ralph Taggart, Christine Evers, Lisa StarrPublisher:Cengage Learning
 Biology: The Dynamic Science (MindTap Course List)BiologyISBN:9781305389892Author:Peter J. Russell, Paul E. Hertz, Beverly McMillanPublisher:Cengage Learning
 Biology: The Unity and Diversity of Life (MindTap...BiologyISBN:9781337408332Author:Cecie Starr, Ralph Taggart, Christine Evers, Lisa StarrPublisher:Cengage Learning
 Human Biology (MindTap Course List)BiologyISBN:9781305112100Author:Cecie Starr, Beverly McMillanPublisher:Cengage Learning