
Biology 2e
2nd Edition
ISBN: 9781947172517
Author: Matthew Douglas, Jung Choi, Mary Ann Clark
Publisher: OpenStax
expand_more
expand_more
format_list_bulleted
Concept explainers
Videos
Textbook Question
Chapter 45, Problem 3VCQ
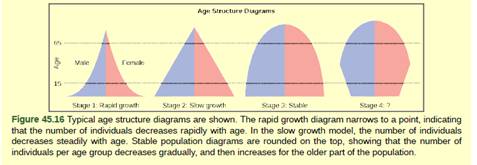
Figure 45.16 Age structure diagrams for rapidly growing, slow growing, and stable populations are shown in stages 1 through 3. What type of population change do you think stage 4 represents?
Expert Solution & Answer

Trending nowThis is a popular solution!

Students have asked these similar questions
An urgent care center experienced the average patient admissions shown in the Table below during the weeks from the first week of December through the second week of April.
Week
Average Daily Admissions
1-Dec
11
2-Dec
14
3-Dec
17
4-Dec
15
1-Jan
12
2-Jan
11
3-Jan
9
4-Jan
9
1-Feb
12
2-Feb
8
3-Feb
13
4-Feb
11
1-Mar
15
2-Mar
17
3-Mar
14
4-Mar
19
5-Mar
13
1-Apr
17
2-Apr
13
Forecast admissions for the periods from the first week of December through the second week of April. Compare the forecast admissions to the actual admissions; What do you conclude?
Analyze the effectiveness of the a drug treatment program based on the needs of 18-65 year olds who are in need of treatment by critically describing 4 things in the program is doing effectively and 4 things the program needs some improvement.
I have the first half finished... just need the bottom half.
Chapter 45 Solutions
Biology 2e
Ch. 45 - Figure 45.2 As this graph shows, population...Ch. 45 - Figure 45.10b If the major food source of the...Ch. 45 - Figure 45.16 Age structure diagrams for rapidly...Ch. 45 - Which of the following methods will tell an...Ch. 45 - Which of the following is best at showing the life...Ch. 45 - Humans have which type of survivorship curve? Type...Ch. 45 - How is a clumped population distribution...Ch. 45 - Which of the following is associated with...Ch. 45 - Which of the following is associated with multiple...Ch. 45 - Which of the following is associated with the...
Ch. 45 - Species with limited resources usually exhibit...Ch. 45 - The maximum rate of increased characteristic of a...Ch. 45 - The population size of a species capable of being...Ch. 45 - Species that have many offspring at one time are...Ch. 45 - A forest fire is an example of regulation....Ch. 45 - Primates are examples of: density-dependent...Ch. 45 - Which of the following statements does not support...Ch. 45 - Which of the following events would not negatively...Ch. 45 - A country with zero population growth is likely to...Ch. 45 - Which type of country has the greatest proportion...Ch. 45 - Which of the following is not a way that humans...Ch. 45 - The first species to live on new land, such as...Ch. 45 - Which type of mimicry involves multiple species...Ch. 45 - A symbiotic relationship where both of the...Ch. 45 - Which of the following is not a mutualistic...Ch. 45 - The ability of rats to learn how to run a maze is...Ch. 45 - The training of animals usually involves...Ch. 45 - The sacrifice of the life of an individual so that...Ch. 45 - Why are polyandrous mating systems more rare than...Ch. 45 - Describe how a researcher would determine the size...Ch. 45 - The CDC released the following data in its 2013...Ch. 45 - Why is long-term parental care not associated with...Ch. 45 - Describe the difference in evolutionary pressures...Ch. 45 - Describe the rate of population growth that would...Ch. 45 - Describe how the population of a species that...Ch. 45 - Give an example of how density-dependent and...Ch. 45 - Describe the age structures in rapidly growing...Ch. 45 - Since the introduction of the Endangered Species...Ch. 45 - Describe the competitive exclusion principle and...Ch. 45 - Jaguars are a keystone species in the Amazon....Ch. 45 - Describe Pavlov’s dog experiments as an example of...Ch. 45 - Describe the advantage of using an aural or...
Additional Science Textbook Solutions
Find more solutions based on key concepts
The central nervous system is responsible for: a. integrative functions. b. sensory functions. c. motor functio...
Human Anatomy & Physiology (2nd Edition)
Analyzing ecological footprints reveals that (A) Earth's carrying capacity would increase if per capita meat co...
Campbell Biology (11th Edition)
Match the following examples of mutagens. Column A Column B ___a. A mutagen that is incorporated into DNA in pl...
Microbiology: An Introduction
Distinguish between microevolution, speciation, and macroevolution.
Campbell Essential Biology (7th Edition)
5. When the phenotype of heterozygotes is intermediate between the phenotypes of the two homozygotes, this patt...
Biology: Life on Earth (11th Edition)
What are four functions of connective tissue?
Anatomy & Physiology (6th Edition)
Knowledge Booster


Learn more about
Need a deep-dive on the concept behind this application? Look no further. Learn more about this topic, biology and related others by exploring similar questions and additional content below.Similar questions
- 13. Practice Calculations: 3 colonies were suspended in the following dilution series and then a viable plate count and microscope count was performed. Calculate IDF's, TDF's and then calculate the CFU/mL in each tube by both methods. Finally calculate the cells in 1 colony by both methods. Show all of your calculations in the space provided on the following pages. 3 colonies 56 cells 10 μL 10 μL 100 μL 500 με m OS A B D 5.0 mL 990 με 990 με 900 με 500 μL EN 2 100 με 100 μL 118 colonies 12 coloniesarrow_forwardDescribe and give a specific example of how successionary stage is related to species diversity?arrow_forwardExplain down bellow what happens to the cell in pictures not in words: Decreased pH in mitochondria Increased ATP Decreased pH in cytosol Increased hydrolysis Decreasing glycogen and triglycerides Increased MAP kinase activity Poor ion transport → For each one:→ What normally happens?→ What is wrong now?→ How does it mess up the cell?arrow_forward
- 1.) Community Diversity: The brown and orange line represent two different plant communities. a. Which color represents the community with a higher species richness? b. Which color represents the community with a higher species evenness? Relative abundance 0.1 0.04 0.001 2 4 6 8 10 12 14 16 18 20 22 24 Rank abundance c. What is the maximum value of the Simpson's diversity index (remember, Simpson's index is D = p², Simpson's diversity index is 1-D)? d. If the Simpson's diversity index equals 1, what does that mean about the number of species and their relative abundance within community being assessed?arrow_forward1.) Community Diversity: The brown and orange line represent two different plant communities. a. Which color represents the community with a higher species richness? b. Which color represents the community with a higher species evenness? Relative abundance 0.1 0.04 0.001 2 4 6 8 10 12 14 16 18 20 22 24 Rank abundance c. What is the maximum value of the Simpson's diversity index (remember, Simpson's index is D = p², Simpson's diversity index is 1-D)? d. If the Simpson's diversity index equals 1, what does that mean about the number of species and their relative abundance within community being assessed?arrow_forwardwhat measures can a mother to take to improve the produce of her to milk to her newborn baby ?arrow_forward
- 1. Color the line that represents all ancestors of the Eastern white pine tree green (but only the ancestral line NOT shared with other organisms) 2. Oncle the last common ancestor of the Colorado blue spruce tree and Eastern white pine tree. 3. Put a box around the last common ancestor of the sugar maple tree and the dogwood tree. 4. Put a triangle around the last common ancestor of the red pine tree and the american holly bush. 5. Color the line that represents all ancestors of the Ponderosa pine tree red (including all shared ancestors). 6. Color the line that represents all ancestors of the American elm tree blue (including all shared ancestors). 7 Color the line that represents all ancestors of the Sabal palm tree purple (including all shared ancestors) 8. Using a yellow highlighter or colored pencil, circle the clade that includes all pine trees. 9. Using a orange highlighter or colored pencil, circle the clade that includes all gymnosperms 10. Can you tell…arrow_forwardYou have been hired as a public relations specialist to give invertebrates a good name. After all, they are much more than just creepy crawly bugs! Your first task though is to convince yourself that is true. The best way to do that is to start close to home. Find something in your house that is a product obtained directly from an invertebrate or only due to an invertebrate’s actions. Describe the product, its function and utility, as well as any human manufactured alternatives. Be sure to highlight the advantages of obtaining this directly from nature. Keep in mind, a product can be something you use, wear, eat, or enjoy for its visual appeal.arrow_forwardUse the following tree diagram to answer Questions #8-10. 8) Which of the following two animals are the most closely related based on the tree to the left? a) Pig and camel b) Hippo and pig c) Deer and cow 9) CIRCLE on the tree diagram where the common ancestor between a hippo and a cow is. 10) Put a SQUARE on the tree diagram where the common ancestor between a pig and a peccary is.arrow_forward
- Explain: Healthy Cell Function Overview→ Briefly describe how a healthy cell usually works: metabolism (ATP production), pH balance, glycogen storage, ion transport, enzymes, etc. Gene Mutation and Genetics Part→ Focus on the autosomal recessive mutation and explain: How gene mutation affects the cell. How autosomal inheritance works. Compare the normal and mutated gene sequences simply. → Talk about possible consequences of a faulty hydrolytic enzyme.arrow_forwardCan you fill out those termsarrow_forwardExplain down bellow what happens to the cell: Decreased pH in mitochondria Increased ATP Decreased pH in cytosol Increased hydrolysis Decreasing glycogen and triglycerides Increased MAP kinase activity Poor ion transport → For each one:→ What normally happens?→ What is wrong now?→ How does it mess up the cell?arrow_forward
arrow_back_ios
SEE MORE QUESTIONS
arrow_forward_ios
Recommended textbooks for you
- Biology 2eBiologyISBN:9781947172517Author:Matthew Douglas, Jung Choi, Mary Ann ClarkPublisher:OpenStax
 Concepts of BiologyBiologyISBN:9781938168116Author:Samantha Fowler, Rebecca Roush, James WisePublisher:OpenStax College
 Biology (MindTap Course List)BiologyISBN:9781337392938Author:Eldra Solomon, Charles Martin, Diana W. Martin, Linda R. BergPublisher:Cengage Learning
  Biology Today and Tomorrow without Physiology (Mi...BiologyISBN:9781305117396Author:Cecie Starr, Christine Evers, Lisa StarrPublisher:Cengage Learning
 Case Studies In Health Information ManagementBiologyISBN:9781337676908Author:SCHNERINGPublisher:Cengage
 Biology: The Dynamic Science (MindTap Course List)BiologyISBN:9781305389892Author:Peter J. Russell, Paul E. Hertz, Beverly McMillanPublisher:Cengage Learning
Biology 2e
Biology
ISBN:9781947172517
Author:Matthew Douglas, Jung Choi, Mary Ann Clark
Publisher:OpenStax
Concepts of Biology
Biology
ISBN:9781938168116
Author:Samantha Fowler, Rebecca Roush, James Wise
Publisher:OpenStax College
Biology (MindTap Course List)
Biology
ISBN:9781337392938
Author:Eldra Solomon, Charles Martin, Diana W. Martin, Linda R. Berg
Publisher:Cengage Learning
Biology Today and Tomorrow without Physiology (Mi...
Biology
ISBN:9781305117396
Author:Cecie Starr, Christine Evers, Lisa Starr
Publisher:Cengage Learning
Case Studies In Health Information Management
Biology
ISBN:9781337676908
Author:SCHNERING
Publisher:Cengage
Biology: The Dynamic Science (MindTap Course List)
Biology
ISBN:9781305389892
Author:Peter J. Russell, Paul E. Hertz, Beverly McMillan
Publisher:Cengage Learning
POPULATION REGULATION AND LIMITING FACTORS | DENSITY INDEPENDENT AND DENSITY DEPENDENT FACTORS; Author: BioVidyalaya;https://www.youtube.com/watch?v=mB-AB-5Wnhs;License: Standard YouTube License, CC-BY
Population growth; Author: SiouxScience;https://www.youtube.com/watch?v=XnaC9iOumVA;License: Standard YouTube License, CC-BY