
Mathematics All Around (6th Edition)
6th Edition
ISBN: 9780134434681
Author: Tom Pirnot
Publisher: PEARSON
expand_more
expand_more
format_list_bulleted
Question
Chapter 4.3, Problem 7E
To determine
To construct:
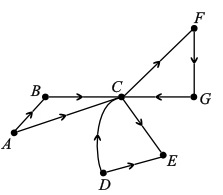
A table that displays the number of directed paths of length 1 or 2 between each pair of vertices in the graph of Exercise 3.
Expert Solution & Answer
Want to see the full answer?
Check out a sample textbook solution
Students have asked these similar questions
/ Solve the equation Laplac transfoms:-
wt = wxx
WCX10) = 0
w (o,t)
=
f(t)
lim w(x,t) = 0
X∞
Q/Find the Fourier sine and cosine transforms of
f(x) =
Xe-X
Q/solve the equation Laplac transforms:-
x>0, to
43
1
иху
u cx,α) = f(x)
и
a Cort ) = •
lim u(x,t) = 0
8700
و
X>0
, to
Chapter 4 Solutions
Mathematics All Around (6th Edition)
Ch. 4.1 - In Exercise 1-6, determine whether the graph is...Ch. 4.1 - In Exercise 1-6, determine whether the graph is...Ch. 4.1 - In Exercise 1-6, determine whether the graph is...Ch. 4.1 - In Exercise 1-6, determine whether the graph is...Ch. 4.1 - In Exercise 1-6, determine whether the graph is...Ch. 4.1 - In Exercise 1-6, determine whether the graph is...Ch. 4.1 - In Exercises 7-12, use Eulers theorem to decide...Ch. 4.1 - In Exercises 7-12, use Eulers theorem to decide...Ch. 4.1 - In Exercises 7-12, use Eulers theorem to decide...Ch. 4.1 - In Exercises 7-12, use Eulers theorem to decide...
Ch. 4.1 - In Exercises 7-12, use Eulers theorem to decide...Ch. 4.1 - In Exercises 7-12, use Eulers theorem to decide...Ch. 4.1 - In Exercise 13-16, if the given graph is Eulerian,...Ch. 4.1 - In Exercise 13-16, if the given graph is Eulerian,...Ch. 4.1 - In Exercise 13-16, if the given graph is Eulerian,...Ch. 4.1 - In Exercise 13-16, if the given graph is Eulerian,...Ch. 4.1 - In Exercises 17-24, try to give an example of each...Ch. 4.1 - Prob. 18ECh. 4.1 - In Exercises 17-24, try to give an example of each...Ch. 4.1 - In Exercises 17-24, try to give an example of each...Ch. 4.1 - In Exercises 17-24, try to give an example of each...Ch. 4.1 - Prob. 22ECh. 4.1 - Prob. 23ECh. 4.1 - Prob. 24ECh. 4.1 - In Exercise 25-28, remove one edge to make the...Ch. 4.1 - Prob. 26ECh. 4.1 - Prob. 27ECh. 4.1 - In Exercise 25-28, remove one edge to make the...Ch. 4.1 - In Exercise 29-32, try to redraw the given graph...Ch. 4.1 - In Exercise 29-32, try to redraw the given graph...Ch. 4.1 - In Exercise 29-32, try to redraw the given graph...Ch. 4.1 - In Exercise 29-32, try to redraw the given graph...Ch. 4.1 - Finding an efficient route. A taxi driver wants to...Ch. 4.1 - Finding an efficient route. Repeat Exercises 33...Ch. 4.1 - Exercise 35 and 36 are similar to DUCK tour...Ch. 4.1 - Exercise 35 and 36 are similar to DUCK tour...Ch. 4.1 - Represent the maps given in Exercises 37-40 by...Ch. 4.1 - Represent the maps given in Exercises 37-40 by...Ch. 4.1 - Represent the maps given in Exercises 37-40 by...Ch. 4.1 - Represent the maps given in Exercises 37-40 by...Ch. 4.1 - Prob. 41ECh. 4.1 - Prob. 42ECh. 4.1 - Prob. 43ECh. 4.1 - Prob. 44ECh. 4.1 - Prob. 45ECh. 4.1 - Prob. 46ECh. 4.1 - Prob. 47ECh. 4.1 - In Exercises 4548, we give you a group of states....Ch. 4.1 - Finding an efficient route. Because of Michaels...Ch. 4.1 - Prob. 50ECh. 4.1 - Use the technique that we used in Example 7 to do...Ch. 4.1 - Use the technique that we used in Example 7 to do...Ch. 4.1 - Use the technique that we used in Example 7 to do...Ch. 4.1 - Use the technique that we used in Example 7 to do...Ch. 4.1 - If, in tracing a graph, we neither begin nor end...Ch. 4.1 - Examine a number of the graphs that we have drawn...Ch. 4.1 - Can an Eulerian graph have a bridge? In order to...Ch. 4.1 - Consider any graph that has some odd and also some...Ch. 4.1 - Discuss specific examples of ways that...Ch. 4.1 - Prob. 60ECh. 4.1 - Draw a graph that can be colored with only two...Ch. 4.1 - Draw a graph that cannot be colored with two...Ch. 4.1 - Draw a graph that cannot be colored with three...Ch. 4.1 - Can you state what configuration of vertices will...Ch. 4.1 - Different notes on a trumpet are obtained by...Ch. 4.1 - If an instrument has four valves, there are 16...Ch. 4.1 - Assume that the registrar at your school is...Ch. 4.1 - Make up a scheduling problem that would be of some...Ch. 4.2 - Prob. 1ECh. 4.2 - Prob. 2ECh. 4.2 - Prob. 3ECh. 4.2 - Prob. 4ECh. 4.2 - Prob. 5ECh. 4.2 - Prob. 6ECh. 4.2 - Prob. 7ECh. 4.2 - Prob. 8ECh. 4.2 - How many Hamilton circuits are in K7?Ch. 4.2 - How many Hamilton circuits are in K8?Ch. 4.2 - Prob. 11ECh. 4.2 - Prob. 12ECh. 4.2 - Prob. 13ECh. 4.2 - Prob. 14ECh. 4.2 - Prob. 15ECh. 4.2 - Prob. 16ECh. 4.2 - Prob. 17ECh. 4.2 - Prob. 18ECh. 4.2 - Prob. 19ECh. 4.2 - Prob. 20ECh. 4.2 - Prob. 21ECh. 4.2 - Prob. 22ECh. 4.2 - Prob. 23ECh. 4.2 - Prob. 24ECh. 4.2 - In Exercises 23 -28, use the best edge algorithm...Ch. 4.2 - Prob. 26ECh. 4.2 - In Exercise 23 -28, use the best edge algorithm to...Ch. 4.2 - In Exercise 23 -28, use the best edge algorithm to...Ch. 4.2 - Simon Cowell plans a series of live shows from...Ch. 4.2 - ESPN is planning to do a special series called...Ch. 4.2 - Foodandwine.com states that the best ice cream...Ch. 4.2 - In order to try to solve a European financial...Ch. 4.2 - Prob. 33ECh. 4.2 - Prob. 34ECh. 4.2 - Prob. 35ECh. 4.2 - Prob. 36ECh. 4.2 - Prob. 37ECh. 4.2 - Prob. 38ECh. 4.2 - Prob. 39ECh. 4.2 - Prob. 40ECh. 4.2 - Prob. 41ECh. 4.2 - Prob. 42ECh. 4.2 - Prob. 43ECh. 4.2 - Prob. 44.1ECh. 4.2 - Prob. 44.2ECh. 4.2 - Prob. 45.1ECh. 4.2 - Prob. 45.2ECh. 4.2 - Prob. 45.3ECh. 4.2 - Prob. 49ECh. 4.2 - Prob. 51ECh. 4.2 - Prob. 52ECh. 4.3 - In Exercises 1-4, use each graph to find the...Ch. 4.3 - In Exercises 1-4, use each graph to find the...Ch. 4.3 - In Exercises 1-4, use each graph to find the...Ch. 4.3 - In Exercises 1-4, use each graph to find the...Ch. 4.3 - Prob. 5ECh. 4.3 - Prob. 6ECh. 4.3 - Prob. 7ECh. 4.3 - Prob. 8ECh. 4.3 - Modeling the spread of rumours. Ryan, Dwight, Pam,...Ch. 4.3 - Modeling the spread of classified information....Ch. 4.3 - Modeling the flow of paperwork through a...Ch. 4.3 - Modeling the spread of disease. The following...Ch. 4.3 - Prob. 13ECh. 4.3 - Modeling a communication network. An AMBER alert...Ch. 4.3 - Ranking football teams. The given graph shows the...Ch. 4.3 - Ranking American Gladiators. The graph below shows...Ch. 4.3 - Modeling influence. A designer who wishes to...Ch. 4.3 - Prob. 18ECh. 4.3 - Prob. 19ECh. 4.3 - Ranking CrossFit competitors. CrossFit is a...Ch. 4.3 - Prob. 21ECh. 4.3 - Prob. 22ECh. 4.3 - Prob. 23ECh. 4.3 - Prob. 24ECh. 4.3 - Prob. 25ECh. 4.3 - Prob. 26ECh. 4.3 - Prob. 27ECh. 4.3 - Prob. 28ECh. 4.3 - Prob. 29ECh. 4.3 - Communicating Mathematics In the incidence...Ch. 4.3 - Math in Your Life: Between the Numbers The history...Ch. 4.3 - Prob. 32ECh. 4.3 - Prob. 33ECh. 4.3 - Prob. 34ECh. 4.4 - Sharpening Your Skills. In Exercises 1 4, assume...Ch. 4.4 - Sharpening Your Skills. In Exercises 1 4, assume...Ch. 4.4 - Sharpening Your Skills. In Exercises 1 4, assume...Ch. 4.4 - Sharpening Your Skills. In Exercises 1 4, assume...Ch. 4.4 - Sharpening Your Skills. In Exercises 5 8, use the...Ch. 4.4 - Sharpening Your Skills. In Exercises 5 8, use the...Ch. 4.4 - Sharpening Your Skills. In Exercises 5 8, use the...Ch. 4.4 - Sharpening Your Skills. In Exercises 5 8, use the...Ch. 4.4 - Applying What Youve Learned. Planning a festival....Ch. 4.4 - Applying What Youve Learned. Organizing a project....Ch. 4.4 - Applying What Youve Learned. Building a student...Ch. 4.4 - Applying What Youve Learned. Organizing a health...Ch. 4.4 - Applying What Youve Learned. Organizing an...Ch. 4.4 - Communicating Mathematics. Study Figure 4.35 with...Ch. 4.4 - Communicating Mathematics. Write a brief report on...Ch. 4.4 - Challenge yourself. Planning an innovative house....Ch. 4.CR - Section 4.1 Use the preceding graph to answer the...Ch. 4.CR - Section 4.1 Explain how graphs are used to model a...Ch. 4.CR - Section 4.1 Which of the following graphs can be...Ch. 4.CR - Section 4.1 Use Fleurys algorithm to find an Euler...Ch. 4.CR - Section 4.1 Model the following street map with a...Ch. 4.CR - Prob. 6CRCh. 4.CR - Section 4.1 Allison, Branden, Colin, Donny, Erica,...Ch. 4.CR - Section 4.2 Find all Hamilton circuits that begin...Ch. 4.CR - Section 4.2 Use the following weighted graph to...Ch. 4.CR - Section 4.2 Use the following weighted graph to...Ch. 4.CR - Prob. 11CRCh. 4.CR - Prob. 12CRCh. 4.CR - Section 4.3 When are directed graphs rather than...Ch. 4.CR - Section 4.3 A student action committee has been...Ch. 4.CR - Section 4.4 Use the following PERT diagram to...Ch. 4.CR - Section 4.4 Congratulations You are planning your...Ch. 4.CT - Use the preceding graph to answer the following...Ch. 4.CT - Which of the following graphs can be traced? If a...Ch. 4.CT - Use Fleurys algorithm to find an Euler circuit in...Ch. 4.CT - Find all Hamilton circuits that begin at vertex A...Ch. 4.CT - Model the following street map with a graph and...Ch. 4.CT - Prob. 6CTCh. 4.CT - Use the following weighted graph to answer...Ch. 4.CT - Use the following weighted graph to answer...Ch. 4.CT - Use the following weighted graph to answer...Ch. 4.CT - Use the given directed graph to find the following...Ch. 4.CT - Use the given PERT diagram to answer the following...Ch. 4.CT - The following graph models one- and two-stage...
Knowledge Booster

Similar questions
- Use a graphing calculator to find where the curves intersect and to find the area between the curves. y=ex, y=-x²-4x a. The left point of intersection is (Type integers or decimals rounded to the nearest thousandth as needed. Type an ordered pair.)arrow_forwardFind the area between the curves. x= -5, x=3, y=2x² +9, y=0 The area between the curves is (Round to the nearest whole number as needed.)arrow_forwardcan you solve these questions with step by step with clear explaination pleasearrow_forward
- Find the area between the following curves. x=-1, x=3, y=x-1, and y=0 The area between the curves is (Simplify your answer.)arrow_forwardFind the area between the curves. x= − 2, x= 3, y=5x, y=x? - 6 6 The area between the curves is (Simplify your answer.) ...arrow_forwardPlease conduct a step by step of these statistical tests on separate sheets of Microsoft Excel. If the calculations in Microsoft Excel are incorrect, the null and alternative hypotheses, as well as the conclusions drawn from them, will be meaningless and will not receive any points. 4. One-Way ANOVA: Analyze the customer satisfaction scores across four different product categories to determine if there is a significant difference in means. (Hints: The null can be about maintaining status-quo or no difference among groups) H0 = H1=arrow_forward
- Please conduct a step by step of these statistical tests on separate sheets of Microsoft Excel. If the calculations in Microsoft Excel are incorrect, the null and alternative hypotheses, as well as the conclusions drawn from them, will be meaningless and will not receive any points 2. Two-Sample T-Test: Compare the average sales revenue of two different regions to determine if there is a significant difference. (Hints: The null can be about maintaining status-quo or no difference among groups; if alternative hypothesis is non-directional use the two-tailed p-value from excel file to make a decision about rejecting or not rejecting null) H0 = H1=arrow_forwardPlease conduct a step by step of these statistical tests on separate sheets of Microsoft Excel. If the calculations in Microsoft Excel are incorrect, the null and alternative hypotheses, as well as the conclusions drawn from them, will be meaningless and will not receive any points 3. Paired T-Test: A company implemented a training program to improve employee performance. To evaluate the effectiveness of the program, the company recorded the test scores of 25 employees before and after the training. Determine if the training program is effective in terms of scores of participants before and after the training. (Hints: The null can be about maintaining status-quo or no difference among groups; if alternative hypothesis is non-directional, use the two-tailed p-value from excel file to make a decision about rejecting or not rejecting the null) H0 = H1= Conclusion:arrow_forwardplease question 9arrow_forward
- Please conduct a step by step of these statistical tests on separate sheets of Microsoft Excel. If the calculations in Microsoft Excel are incorrect, the null and alternative hypotheses, as well as the conclusions drawn from them, will be meaningless and will not receive any points. The data for the following questions is provided in Microsoft Excel file on 4 separate sheets. Please conduct these statistical tests on separate sheets of Microsoft Excel. If the calculations in Microsoft Excel are incorrect, the null and alternative hypotheses, as well as the conclusions drawn from them, will be meaningless and will not receive any points. 1. One Sample T-Test: Determine whether the average satisfaction rating of customers for a product is significantly different from a hypothetical mean of 75. (Hints: The null can be about maintaining status-quo or no difference; If your alternative hypothesis is non-directional (e.g., μ≠75), you should use the two-tailed p-value from excel file to…arrow_forwardPlease conduct a step by step of these statistical tests on separate sheets of Microsoft Excel. If the calculations in Microsoft Excel are incorrect, the null and alternative hypotheses, as well as the conclusions drawn from them, will be meaningless and will not receive any points. The data for the following questions is provided in Microsoft Excel file on 4 separate sheets. Please conduct these statistical tests on separate sheets of Microsoft Excel. If the calculations in Microsoft Excel are incorrect, the null and alternative hypotheses, as well as the conclusions drawn from them, will be meaningless and will not receive any points. 1. One Sample T-Test: Determine whether the average satisfaction rating of customers for a product is significantly different from a hypothetical mean of 75. (Hints: The null can be about maintaining status-quo or no difference; If your alternative hypothesis is non-directional (e.g., μ≠75), you should use the two-tailed p-value from excel file to…arrow_forwardUse the definite integral to find the area between the x-axis and f(x) over the indicated interval. Check first to see if the graph crosses the x-axis in the given interval. 3. f(x) = 4x; [-5,3]arrow_forward
arrow_back_ios
SEE MORE QUESTIONS
arrow_forward_ios
Recommended textbooks for you
 Discrete Mathematics and Its Applications ( 8th I...MathISBN:9781259676512Author:Kenneth H RosenPublisher:McGraw-Hill Education
 Mathematics for Elementary Teachers with Activiti...MathISBN:9780134392790Author:Beckmann, SybillaPublisher:PEARSON
 Thinking Mathematically (7th Edition)MathISBN:9780134683713Author:Robert F. BlitzerPublisher:PEARSON
 Discrete Mathematics With ApplicationsMathISBN:9781337694193Author:EPP, Susanna S.Publisher:Cengage Learning,
 Pathways To Math Literacy (looseleaf)MathISBN:9781259985607Author:David Sobecki Professor, Brian A. MercerPublisher:McGraw-Hill Education
Discrete Mathematics and Its Applications ( 8th I...
Math
ISBN:9781259676512
Author:Kenneth H Rosen
Publisher:McGraw-Hill Education
Mathematics for Elementary Teachers with Activiti...
Math
ISBN:9780134392790
Author:Beckmann, Sybilla
Publisher:PEARSON
Thinking Mathematically (7th Edition)
Math
ISBN:9780134683713
Author:Robert F. Blitzer
Publisher:PEARSON
Discrete Mathematics With Applications
Math
ISBN:9781337694193
Author:EPP, Susanna S.
Publisher:Cengage Learning,
Pathways To Math Literacy (looseleaf)
Math
ISBN:9781259985607
Author:David Sobecki Professor, Brian A. Mercer
Publisher:McGraw-Hill Education