
Mathematics All Around (6th Edition)
6th Edition
ISBN: 9780134434681
Author: Tom Pirnot
Publisher: PEARSON
expand_more
expand_more
format_list_bulleted
Videos
Textbook Question
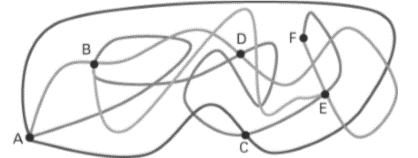
Chapter 4.1, Problem 28E
In Exercise 25-28, remove one edge to make the graph Eulerian.
Expert Solution & Answer
Want to see the full answer?
Check out a sample textbook solution
Students have asked these similar questions
Answer number one
answer number 4
3. Bayesian Inference – Updating Beliefs
A medical test for a rare disease has the following characteristics:
Sensitivity (true positive rate): 99%
Specificity (true negative rate): 98%
The disease occurs in 0.5% of the population.
A patient receives a positive test result.
Questions:
a) Define the relevant events and use Bayes’ Theorem to compute the probability that the patient actually has the disease.b) Explain why the result might seem counterintuitive, despite the high sensitivity and specificity.c) Discuss how prior probabilities influence posterior beliefs in Bayesian inference.d) Suppose a second, independent test with the same accuracy is conducted and is also positive. Update the probability that the patient has the disease.
Chapter 4 Solutions
Mathematics All Around (6th Edition)
Ch. 4.1 - In Exercise 1-6, determine whether the graph is...Ch. 4.1 - In Exercise 1-6, determine whether the graph is...Ch. 4.1 - In Exercise 1-6, determine whether the graph is...Ch. 4.1 - In Exercise 1-6, determine whether the graph is...Ch. 4.1 - In Exercise 1-6, determine whether the graph is...Ch. 4.1 - In Exercise 1-6, determine whether the graph is...Ch. 4.1 - In Exercises 7-12, use Eulers theorem to decide...Ch. 4.1 - In Exercises 7-12, use Eulers theorem to decide...Ch. 4.1 - In Exercises 7-12, use Eulers theorem to decide...Ch. 4.1 - In Exercises 7-12, use Eulers theorem to decide...
Ch. 4.1 - In Exercises 7-12, use Eulers theorem to decide...Ch. 4.1 - In Exercises 7-12, use Eulers theorem to decide...Ch. 4.1 - In Exercise 13-16, if the given graph is Eulerian,...Ch. 4.1 - In Exercise 13-16, if the given graph is Eulerian,...Ch. 4.1 - In Exercise 13-16, if the given graph is Eulerian,...Ch. 4.1 - In Exercise 13-16, if the given graph is Eulerian,...Ch. 4.1 - In Exercises 17-24, try to give an example of each...Ch. 4.1 - Prob. 18ECh. 4.1 - In Exercises 17-24, try to give an example of each...Ch. 4.1 - In Exercises 17-24, try to give an example of each...Ch. 4.1 - In Exercises 17-24, try to give an example of each...Ch. 4.1 - Prob. 22ECh. 4.1 - Prob. 23ECh. 4.1 - Prob. 24ECh. 4.1 - In Exercise 25-28, remove one edge to make the...Ch. 4.1 - Prob. 26ECh. 4.1 - Prob. 27ECh. 4.1 - In Exercise 25-28, remove one edge to make the...Ch. 4.1 - In Exercise 29-32, try to redraw the given graph...Ch. 4.1 - In Exercise 29-32, try to redraw the given graph...Ch. 4.1 - In Exercise 29-32, try to redraw the given graph...Ch. 4.1 - In Exercise 29-32, try to redraw the given graph...Ch. 4.1 - Finding an efficient route. A taxi driver wants to...Ch. 4.1 - Finding an efficient route. Repeat Exercises 33...Ch. 4.1 - Exercise 35 and 36 are similar to DUCK tour...Ch. 4.1 - Exercise 35 and 36 are similar to DUCK tour...Ch. 4.1 - Represent the maps given in Exercises 37-40 by...Ch. 4.1 - Represent the maps given in Exercises 37-40 by...Ch. 4.1 - Represent the maps given in Exercises 37-40 by...Ch. 4.1 - Represent the maps given in Exercises 37-40 by...Ch. 4.1 - Prob. 41ECh. 4.1 - Prob. 42ECh. 4.1 - Prob. 43ECh. 4.1 - Prob. 44ECh. 4.1 - Prob. 45ECh. 4.1 - Prob. 46ECh. 4.1 - Prob. 47ECh. 4.1 - In Exercises 4548, we give you a group of states....Ch. 4.1 - Finding an efficient route. Because of Michaels...Ch. 4.1 - Prob. 50ECh. 4.1 - Use the technique that we used in Example 7 to do...Ch. 4.1 - Use the technique that we used in Example 7 to do...Ch. 4.1 - Use the technique that we used in Example 7 to do...Ch. 4.1 - Use the technique that we used in Example 7 to do...Ch. 4.1 - If, in tracing a graph, we neither begin nor end...Ch. 4.1 - Examine a number of the graphs that we have drawn...Ch. 4.1 - Can an Eulerian graph have a bridge? In order to...Ch. 4.1 - Consider any graph that has some odd and also some...Ch. 4.1 - Discuss specific examples of ways that...Ch. 4.1 - Prob. 60ECh. 4.1 - Draw a graph that can be colored with only two...Ch. 4.1 - Draw a graph that cannot be colored with two...Ch. 4.1 - Draw a graph that cannot be colored with three...Ch. 4.1 - Can you state what configuration of vertices will...Ch. 4.1 - Different notes on a trumpet are obtained by...Ch. 4.1 - If an instrument has four valves, there are 16...Ch. 4.1 - Assume that the registrar at your school is...Ch. 4.1 - Make up a scheduling problem that would be of some...Ch. 4.2 - Prob. 1ECh. 4.2 - Prob. 2ECh. 4.2 - Prob. 3ECh. 4.2 - Prob. 4ECh. 4.2 - Prob. 5ECh. 4.2 - Prob. 6ECh. 4.2 - Prob. 7ECh. 4.2 - Prob. 8ECh. 4.2 - How many Hamilton circuits are in K7?Ch. 4.2 - How many Hamilton circuits are in K8?Ch. 4.2 - Prob. 11ECh. 4.2 - Prob. 12ECh. 4.2 - Prob. 13ECh. 4.2 - Prob. 14ECh. 4.2 - Prob. 15ECh. 4.2 - Prob. 16ECh. 4.2 - Prob. 17ECh. 4.2 - Prob. 18ECh. 4.2 - Prob. 19ECh. 4.2 - Prob. 20ECh. 4.2 - Prob. 21ECh. 4.2 - Prob. 22ECh. 4.2 - Prob. 23ECh. 4.2 - Prob. 24ECh. 4.2 - In Exercises 23 -28, use the best edge algorithm...Ch. 4.2 - Prob. 26ECh. 4.2 - In Exercise 23 -28, use the best edge algorithm to...Ch. 4.2 - In Exercise 23 -28, use the best edge algorithm to...Ch. 4.2 - Simon Cowell plans a series of live shows from...Ch. 4.2 - ESPN is planning to do a special series called...Ch. 4.2 - Foodandwine.com states that the best ice cream...Ch. 4.2 - In order to try to solve a European financial...Ch. 4.2 - Prob. 33ECh. 4.2 - Prob. 34ECh. 4.2 - Prob. 35ECh. 4.2 - Prob. 36ECh. 4.2 - Prob. 37ECh. 4.2 - Prob. 38ECh. 4.2 - Prob. 39ECh. 4.2 - Prob. 40ECh. 4.2 - Prob. 41ECh. 4.2 - Prob. 42ECh. 4.2 - Prob. 43ECh. 4.2 - Prob. 44.1ECh. 4.2 - Prob. 44.2ECh. 4.2 - Prob. 45.1ECh. 4.2 - Prob. 45.2ECh. 4.2 - Prob. 45.3ECh. 4.2 - Prob. 49ECh. 4.2 - Prob. 51ECh. 4.2 - Prob. 52ECh. 4.3 - In Exercises 1-4, use each graph to find the...Ch. 4.3 - In Exercises 1-4, use each graph to find the...Ch. 4.3 - In Exercises 1-4, use each graph to find the...Ch. 4.3 - In Exercises 1-4, use each graph to find the...Ch. 4.3 - Prob. 5ECh. 4.3 - Prob. 6ECh. 4.3 - Prob. 7ECh. 4.3 - Prob. 8ECh. 4.3 - Modeling the spread of rumours. Ryan, Dwight, Pam,...Ch. 4.3 - Modeling the spread of classified information....Ch. 4.3 - Modeling the flow of paperwork through a...Ch. 4.3 - Modeling the spread of disease. The following...Ch. 4.3 - Prob. 13ECh. 4.3 - Modeling a communication network. An AMBER alert...Ch. 4.3 - Ranking football teams. The given graph shows the...Ch. 4.3 - Ranking American Gladiators. The graph below shows...Ch. 4.3 - Modeling influence. A designer who wishes to...Ch. 4.3 - Prob. 18ECh. 4.3 - Prob. 19ECh. 4.3 - Ranking CrossFit competitors. CrossFit is a...Ch. 4.3 - Prob. 21ECh. 4.3 - Prob. 22ECh. 4.3 - Prob. 23ECh. 4.3 - Prob. 24ECh. 4.3 - Prob. 25ECh. 4.3 - Prob. 26ECh. 4.3 - Prob. 27ECh. 4.3 - Prob. 28ECh. 4.3 - Prob. 29ECh. 4.3 - Communicating Mathematics In the incidence...Ch. 4.3 - Math in Your Life: Between the Numbers The history...Ch. 4.3 - Prob. 32ECh. 4.3 - Prob. 33ECh. 4.3 - Prob. 34ECh. 4.4 - Sharpening Your Skills. In Exercises 1 4, assume...Ch. 4.4 - Sharpening Your Skills. In Exercises 1 4, assume...Ch. 4.4 - Sharpening Your Skills. In Exercises 1 4, assume...Ch. 4.4 - Sharpening Your Skills. In Exercises 1 4, assume...Ch. 4.4 - Sharpening Your Skills. In Exercises 5 8, use the...Ch. 4.4 - Sharpening Your Skills. In Exercises 5 8, use the...Ch. 4.4 - Sharpening Your Skills. In Exercises 5 8, use the...Ch. 4.4 - Sharpening Your Skills. In Exercises 5 8, use the...Ch. 4.4 - Applying What Youve Learned. Planning a festival....Ch. 4.4 - Applying What Youve Learned. Organizing a project....Ch. 4.4 - Applying What Youve Learned. Building a student...Ch. 4.4 - Applying What Youve Learned. Organizing a health...Ch. 4.4 - Applying What Youve Learned. Organizing an...Ch. 4.4 - Communicating Mathematics. Study Figure 4.35 with...Ch. 4.4 - Communicating Mathematics. Write a brief report on...Ch. 4.4 - Challenge yourself. Planning an innovative house....Ch. 4.CR - Section 4.1 Use the preceding graph to answer the...Ch. 4.CR - Section 4.1 Explain how graphs are used to model a...Ch. 4.CR - Section 4.1 Which of the following graphs can be...Ch. 4.CR - Section 4.1 Use Fleurys algorithm to find an Euler...Ch. 4.CR - Section 4.1 Model the following street map with a...Ch. 4.CR - Prob. 6CRCh. 4.CR - Section 4.1 Allison, Branden, Colin, Donny, Erica,...Ch. 4.CR - Section 4.2 Find all Hamilton circuits that begin...Ch. 4.CR - Section 4.2 Use the following weighted graph to...Ch. 4.CR - Section 4.2 Use the following weighted graph to...Ch. 4.CR - Prob. 11CRCh. 4.CR - Prob. 12CRCh. 4.CR - Section 4.3 When are directed graphs rather than...Ch. 4.CR - Section 4.3 A student action committee has been...Ch. 4.CR - Section 4.4 Use the following PERT diagram to...Ch. 4.CR - Section 4.4 Congratulations You are planning your...Ch. 4.CT - Use the preceding graph to answer the following...Ch. 4.CT - Which of the following graphs can be traced? If a...Ch. 4.CT - Use Fleurys algorithm to find an Euler circuit in...Ch. 4.CT - Find all Hamilton circuits that begin at vertex A...Ch. 4.CT - Model the following street map with a graph and...Ch. 4.CT - Prob. 6CTCh. 4.CT - Use the following weighted graph to answer...Ch. 4.CT - Use the following weighted graph to answer...Ch. 4.CT - Use the following weighted graph to answer...Ch. 4.CT - Use the given directed graph to find the following...Ch. 4.CT - Use the given PERT diagram to answer the following...Ch. 4.CT - The following graph models one- and two-stage...
Knowledge Booster


Learn more about
Need a deep-dive on the concept behind this application? Look no further. Learn more about this topic, subject and related others by exploring similar questions and additional content below.Similar questions
- answer number 6arrow_forwardanswer number 2arrow_forward4. Linear Regression - Model Assumptions and Interpretation A real estate analyst is studying how house prices (Y) are related to house size in square feet (X). A simple linear regression model is proposed: The analyst fits the model and obtains: • Ŷ50,000+150X YBoB₁X + € • R² = 0.76 • Residuals show a fan-shaped pattern when plotted against fitted values. Questions: a) Interpret the slope coefficient in context. b) Explain what the R² value tells us about the model's performance. c) Based on the residual pattern, what regression assumption is likely violated? What might be the consequence? d) Suggest at least two remedies to improve the model, based on the residual analysis.arrow_forward
- 5. Probability Distributions – Continuous Random Variables A factory machine produces metal rods whose lengths (in cm) follow a continuous uniform distribution on the interval [98, 102]. Questions: a) Define the probability density function (PDF) of the rod length.b) Calculate the probability that a randomly selected rod is shorter than 99 cm.c) Determine the expected value and variance of rod lengths.d) If a sample of 25 rods is selected, what is the probability that their average length is between 99.5 cm and 100.5 cm? Justify your answer using the appropriate distribution.arrow_forward2. Hypothesis Testing - Two Sample Means A nutritionist is investigating the effect of two different diet programs, A and B, on weight loss. Two independent samples of adults were randomly assigned to each diet for 12 weeks. The weight losses (in kg) are normally distributed. Sample A: n = 35, 4.8, s = 1.2 Sample B: n=40, 4.3, 8 = 1.0 Questions: a) State the null and alternative hypotheses to test whether there is a significant difference in mean weight loss between the two diet programs. b) Perform a hypothesis test at the 5% significance level and interpret the result. c) Compute a 95% confidence interval for the difference in means and interpret it. d) Discuss assumptions of this test and explain how violations of these assumptions could impact the results.arrow_forward1. Sampling Distribution and the Central Limit Theorem A company produces batteries with a mean lifetime of 300 hours and a standard deviation of 50 hours. The lifetimes are not normally distributed—they are right-skewed due to some batteries lasting unusually long. Suppose a quality control analyst selects a random sample of 64 batteries from a large production batch. Questions: a) Explain whether the distribution of sample means will be approximately normal. Justify your answer using the Central Limit Theorem. b) Compute the mean and standard deviation of the sampling distribution of the sample mean. c) What is the probability that the sample mean lifetime of the 64 batteries exceeds 310 hours? d) Discuss how the sample size affects the shape and variability of the sampling distribution.arrow_forward
- An airplane flies due west at an airspeed of 428 mph. The wind blows in the direction of 41° south of west at 50 mph. What is the ground speed of the airplane? What is the bearing of the airplane? 428 mph 41° 50 mph a. The ground speed of the airplane is b. The bearing of the airplane is mph. south of west.arrow_forwardRylee's car is stuck in the mud. Roman and Shanice come along in a truck to help pull her out. They attach one end of a tow strap to the front of the car and the other end to the truck's trailer hitch, and the truck starts to pull. Meanwhile, Roman and Shanice get behind the car and push. The truck generates a horizontal force of 377 lb on the car. Roman and Shanice are pushing at a slight upward angle and generate a force of 119 lb on the car. These forces can be represented by vectors, as shown in the figure below. The angle between these vectors is 20.2°. Find the resultant force (the vector sum), then give its magnitude and its direction angle from the positive x-axis. 119 lb 20.2° 377 lb a. The resultant force is (Tip: omit degree notations from your answers; e.g. enter cos(45) instead of cos(45°)) b. It's magnitude is lb. c. It's angle from the positive x-axis isarrow_forwardComplete the table below. For solutions, round to the nearest whole number.arrow_forward
- A biologist is investigating the effect of potential plant hormones by treating 20 stem segments. At the end of the observation period he computes the following length averages: Compound X = 1.18 Compound Y = 1.17 Based on these mean values he concludes that there are no treatment differences. 1) Are you satisfied with his conclusion? Why or why not? 2) If he asked you for help in analyzing these data, what statistical method would you suggest that he use to come to a meaningful conclusion about his data and why? 3) Are there any other questions you would ask him regarding his experiment, data collection, and analysis methods?arrow_forwardBusinessarrow_forwardAnswer first questionarrow_forward
arrow_back_ios
SEE MORE QUESTIONS
arrow_forward_ios
Recommended textbooks for you
 Elementary Geometry For College Students, 7eGeometryISBN:9781337614085Author:Alexander, Daniel C.; Koeberlein, Geralyn M.Publisher:Cengage,
 Linear Algebra: A Modern IntroductionAlgebraISBN:9781285463247Author:David PoolePublisher:Cengage Learning
Elementary Geometry For College Students, 7e
Geometry
ISBN:9781337614085
Author:Alexander, Daniel C.; Koeberlein, Geralyn M.
Publisher:Cengage,
Linear Algebra: A Modern Introduction
Algebra
ISBN:9781285463247
Author:David Poole
Publisher:Cengage Learning
Graph Theory: Euler Paths and Euler Circuits; Author: Mathispower4u;https://www.youtube.com/watch?v=5M-m62qTR-s;License: Standard YouTube License, CC-BY
WALK,TRIAL,CIRCUIT,PATH,CYCLE IN GRAPH THEORY; Author: DIVVELA SRINIVASA RAO;https://www.youtube.com/watch?v=iYVltZtnAik;License: Standard YouTube License, CC-BY