
Videos
Use the technique that we used in Example 7 to do Exercises 51 –54. We do not list duplicate information in the tables.
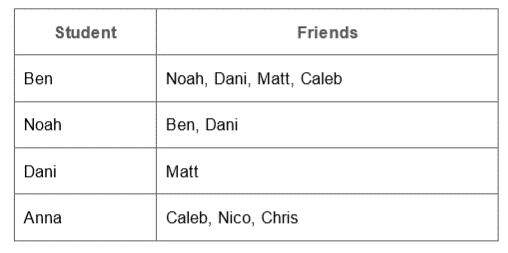
Repeat Exercise 51 using this new table of information.
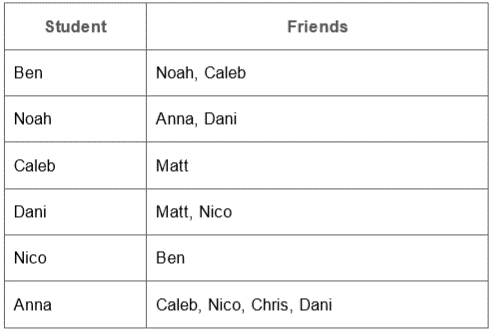
The table summarizes the Facebook “is a friend of” relationship among eight people.
a. Draw a graph to represent this situation
b. Is the graph connected?
c. Does the graph have any bridges?
d. Would it affect the communication within this group if Caleb and Ben unfriend each other?
Example 7 Using a Graph Theory Model to Schedule Committees
Each member of a city council usually serves on several committees to oversee the operation of various aspects of city government. Assume that council members serve on the following committees: police, parks, sanitation, finance, development, streets, fire department, and public relations. Use Table 4.1, which lists committees having common members, to determine a conflict-free schedule for the meetings. We do not duplicate information in Table 4.1. That is, because police conflicts with fire department, we do not also list that fire department conflicts with police.
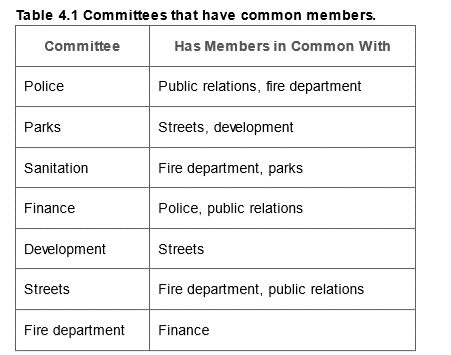
Solution: Recall that in building a graph model, we must have two things:
A set of objects—in this case, the set of committees.1. A relationship among the objects. We will say that two committees are related if the two committees have members in common. So we can model the information in Table 4.1 by the graph in Figure 4.19.
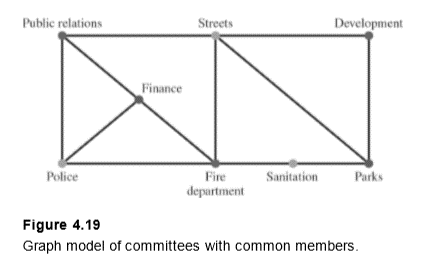
This problem is similar to the map-coloring problem. If we color this graph, then all vertices having the same color represent committees that can meet at the same time. We show one possible coloring of the graph in Figure 4.1.
From Figure 4.19, we see that the police, streets, and sanitation committees have no common members and therefore can meet at the same time. Public relations, development, and the fire department can meet at a second time. Finance and parks can meet at a third time.
Want to see the full answer?
Check out a sample textbook solution
Chapter 4 Solutions
Mathematics All Around (6th Edition)


- 25-30. Normal and tangential components For the vector field F and curve C, complete the following: a. Determine the points (if any) along the curve C at which the vector field F is tangent to C. b. Determine the points (if any) along the curve C at which the vector field F is normal to C. c. Sketch C and a few representative vectors of F on C. 25. F = (2½³, 0); c = {(x, y); y − x² = 1} 26. F = x (23 - 212) ; C = {(x, y); y = x² = 1}) , 2 27. F(x, y); C = {(x, y): x² + y² = 4} 28. F = (y, x); C = {(x, y): x² + y² = 1} 29. F = (x, y); C = 30. F = (y, x); C = {(x, y): x = 1} {(x, y): x² + y² = 1}arrow_forward٣/١ B msl kd 180 Ka, Sin (1) I sin () sin(30) Sin (30) اذا ميريد شرح الكتب بس 0 بالفراغ 3) Cos (30) 0.866 4) Rotating 5) Synchronous speed, 120 x 50 G 5005 1000 s = 1000-950 Copper bosses 5kW Rotor input 5 0.05 : loo kw 6) 1 /0001 ined sove in peaper I need a detailed solution on paper please وه اذا ميريد شرح الكتب فقط ١٥٠ DC 7) rotor a ' (y+xlny + xe*)dx + (xsiny + xlnx + dy = 0. Q1// Find the solution of: ( 357arrow_forward۳/۱ R₂ = X2 2) slots per pole per phase 3/31 B. 180 msl Kas Sin (I) 1sin() sin(30) Sin (30) اذا ميريد شرح الكتب بس 0 بالفراغ 3) Cos (30): 0.866 4) Rotating 5) Synchronous speeds 120×50 looo G 1000-950 1000 Copper losses 5kw Rotor input 5 loo kw 0.05 6) 1 اذا ميريد شرح الكتب فقط look 7) rotor DC ined sove in peaper I need a detailed solution on paper please 0 64 Find the general solution of the following equations: QI//y(4)-16y= 0. Find the general solution of the following equations: Q2ll yll-4y/ +13y=esinx.arrow_forward
- R₂ = X2 2) slots per pole per phase = 3/31 B-180 60 msl kd Kas Sin () 2 I sin (6) sin(30) Sin (30) اذا مريد شرح الكتب بس 0 بالفراغ 3 Cos (30) 0.866 4) Rotating ined sove in peaper 5) Synchronous speed s 120×50 6 s = 1000-950 1000 Copper losses 5kw Rotor input 5 0.05 6) 1 loo kw اذا ميريد شرح الكتب فقط Look 7) rotov DC I need a detailed solution on paper please 0 64 Solve the following equations: 0 Q1// Find the solution of: ( y • with y(0) = 1. dx x²+y²arrow_forwardR₂ = X2 2) slots per pole per phase = 3/3 1 B-180-60 msl Ka Sin (1) Isin () sin(30) Sin (30) اذا ميريد شرح الكتب بس 0 بالفراغ 3) Cos (30) 0.866 4) Rotating 5) Synchronous speed, 120 x 50 s = 1000-950 1000 Copper losses 5kw Rotor input 5 6) 1 0.05 G 50105 loo kw اذا ميريد شرح الكتب فقط look 7) rotov DC ined sove in peaper I need a detailed solution on paper please 064 2- A hot ball (D=15 cm ) is cooled by forced air T.-30°C, the rate of heat transfer from the ball is 460.86 W. Take for the air -0.025 Wim °C and Nu=144.89, find the ball surface temperature a) 300 °C 16 b) 327 °C c) 376 °C d) None か = 750 01arrow_forwardAnswer questions 8.3.3 and 8.3.4 respectively 8.3.4 .WP An article in Medicine and Science in Sports and Exercise [“Electrostimulation Training Effects on the Physical Performance of Ice Hockey Players” (2005, Vol. 37, pp. 455–460)] considered the use of electromyostimulation (EMS) as a method to train healthy skeletal muscle. EMS sessions consisted of 30 contractions (4-second duration, 85 Hz) and were carried out three times per week for 3 weeks on 17 ice hockey players. The 10-meter skating performance test showed a standard deviation of 0.09 seconds. Construct a 95% confidence interval of the standard deviation of the skating performance test.arrow_forward
- 8.6.7 Consider the tire-testing data in Exercise 8.2.3. Compute a 95% tolerance interval on the life of the tires that has confidence level 95%. Compare the length of the tolerance interval with the length of the 95% CI on the population mean. Which interval is shorter? Discuss the difference in interpretation of these two intervals.arrow_forward8.6.2 Consider the natural frequency of beams described in Exercise 8.2.8. Compute a 90% prediction interval on the diameter of the natural frequency of the next beam of this type that will be tested. Compare the length of the prediction interval with the length of the 90% CI on the population mean. 8.6.3 Consider the television tube brightness test described in Exercise 8.2.7. Compute a 99% prediction interval on the brightness of the next tube tested. Compare the length of the prediction interval with the length of the 99% CI on the population mean.arrow_forwardAnswer question S8 stepwisearrow_forward
 Glencoe Algebra 1, Student Edition, 9780079039897...AlgebraISBN:9780079039897Author:CarterPublisher:McGraw Hill
 Algebra: Structure And Method, Book 1AlgebraISBN:9780395977224Author:Richard G. Brown, Mary P. Dolciani, Robert H. Sorgenfrey, William L. ColePublisher:McDougal Littell
 Holt Mcdougal Larson Pre-algebra: Student Edition...AlgebraISBN:9780547587776Author:HOLT MCDOUGALPublisher:HOLT MCDOUGAL
 Algebra & Trigonometry with Analytic GeometryAlgebraISBN:9781133382119Author:SwokowskiPublisher:Cengage
 Big Ideas Math A Bridge To Success Algebra 1: Stu...AlgebraISBN:9781680331141Author:HOUGHTON MIFFLIN HARCOURTPublisher:Houghton Mifflin Harcourt