
Mathematics All Around (6th Edition)
6th Edition
ISBN: 9780134434681
Author: Tom Pirnot
Publisher: PEARSON
expand_more
expand_more
format_list_bulleted
Videos
Textbook Question
Chapter 4.3, Problem 15E
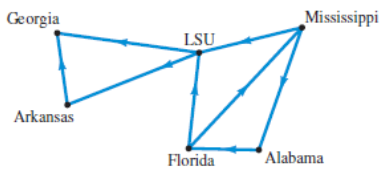
Ranking football teams. The given graph shows the results among several football teams in the Southeast Conference. Rank these teams using one- and two-stage dominance.
Expert Solution & Answer
Want to see the full answer?
Check out a sample textbook solution
Students have asked these similar questions
Answer questions 8.3.3 and 8.3.4 respectively
8.3.4 .WP An article in Medicine and Science in Sports and
Exercise [“Electrostimulation Training Effects on the Physical Performance of Ice Hockey Players” (2005, Vol. 37, pp.
455–460)] considered the use of electromyostimulation (EMS) as
a method to train healthy skeletal muscle. EMS sessions consisted of 30 contractions (4-second duration, 85 Hz) and were carried
out three times per week for 3 weeks on 17 ice hockey players.
The 10-meter skating performance test showed a standard deviation of 0.09 seconds. Construct a 95% confidence interval of the
standard deviation of the skating performance test.
8.6.7 Consider the tire-testing data in Exercise 8.2.3. Compute a 95% tolerance interval on the life of the tires that has confidence level 95%. Compare the length of the tolerance interval with the length of the 95% CI on the population mean. Which interval is shorter? Discuss the difference in interpretation of these two intervals.
8.6.2 Consider the natural frequency of beams described in
Exercise 8.2.8. Compute a 90% prediction interval on the
diameter of the natural frequency of the next beam of this type
that will be tested. Compare the length of the prediction interval
with the length of the 90% CI on the population mean.
8.6.3 Consider the television tube brightness test described in
Exercise 8.2.7. Compute a 99% prediction interval on the brightness of the next tube tested. Compare the length of the prediction
interval with the length of the 99% CI on the population mean.
Chapter 4 Solutions
Mathematics All Around (6th Edition)
Ch. 4.1 - In Exercise 1-6, determine whether the graph is...Ch. 4.1 - In Exercise 1-6, determine whether the graph is...Ch. 4.1 - In Exercise 1-6, determine whether the graph is...Ch. 4.1 - In Exercise 1-6, determine whether the graph is...Ch. 4.1 - In Exercise 1-6, determine whether the graph is...Ch. 4.1 - In Exercise 1-6, determine whether the graph is...Ch. 4.1 - In Exercises 7-12, use Eulers theorem to decide...Ch. 4.1 - In Exercises 7-12, use Eulers theorem to decide...Ch. 4.1 - In Exercises 7-12, use Eulers theorem to decide...Ch. 4.1 - In Exercises 7-12, use Eulers theorem to decide...
Ch. 4.1 - In Exercises 7-12, use Eulers theorem to decide...Ch. 4.1 - In Exercises 7-12, use Eulers theorem to decide...Ch. 4.1 - In Exercise 13-16, if the given graph is Eulerian,...Ch. 4.1 - In Exercise 13-16, if the given graph is Eulerian,...Ch. 4.1 - In Exercise 13-16, if the given graph is Eulerian,...Ch. 4.1 - In Exercise 13-16, if the given graph is Eulerian,...Ch. 4.1 - In Exercises 17-24, try to give an example of each...Ch. 4.1 - Prob. 18ECh. 4.1 - In Exercises 17-24, try to give an example of each...Ch. 4.1 - In Exercises 17-24, try to give an example of each...Ch. 4.1 - In Exercises 17-24, try to give an example of each...Ch. 4.1 - Prob. 22ECh. 4.1 - Prob. 23ECh. 4.1 - Prob. 24ECh. 4.1 - In Exercise 25-28, remove one edge to make the...Ch. 4.1 - Prob. 26ECh. 4.1 - Prob. 27ECh. 4.1 - In Exercise 25-28, remove one edge to make the...Ch. 4.1 - In Exercise 29-32, try to redraw the given graph...Ch. 4.1 - In Exercise 29-32, try to redraw the given graph...Ch. 4.1 - In Exercise 29-32, try to redraw the given graph...Ch. 4.1 - In Exercise 29-32, try to redraw the given graph...Ch. 4.1 - Finding an efficient route. A taxi driver wants to...Ch. 4.1 - Finding an efficient route. Repeat Exercises 33...Ch. 4.1 - Exercise 35 and 36 are similar to DUCK tour...Ch. 4.1 - Exercise 35 and 36 are similar to DUCK tour...Ch. 4.1 - Represent the maps given in Exercises 37-40 by...Ch. 4.1 - Represent the maps given in Exercises 37-40 by...Ch. 4.1 - Represent the maps given in Exercises 37-40 by...Ch. 4.1 - Represent the maps given in Exercises 37-40 by...Ch. 4.1 - Prob. 41ECh. 4.1 - Prob. 42ECh. 4.1 - Prob. 43ECh. 4.1 - Prob. 44ECh. 4.1 - Prob. 45ECh. 4.1 - Prob. 46ECh. 4.1 - Prob. 47ECh. 4.1 - In Exercises 4548, we give you a group of states....Ch. 4.1 - Finding an efficient route. Because of Michaels...Ch. 4.1 - Prob. 50ECh. 4.1 - Use the technique that we used in Example 7 to do...Ch. 4.1 - Use the technique that we used in Example 7 to do...Ch. 4.1 - Use the technique that we used in Example 7 to do...Ch. 4.1 - Use the technique that we used in Example 7 to do...Ch. 4.1 - If, in tracing a graph, we neither begin nor end...Ch. 4.1 - Examine a number of the graphs that we have drawn...Ch. 4.1 - Can an Eulerian graph have a bridge? In order to...Ch. 4.1 - Consider any graph that has some odd and also some...Ch. 4.1 - Discuss specific examples of ways that...Ch. 4.1 - Prob. 60ECh. 4.1 - Draw a graph that can be colored with only two...Ch. 4.1 - Draw a graph that cannot be colored with two...Ch. 4.1 - Draw a graph that cannot be colored with three...Ch. 4.1 - Can you state what configuration of vertices will...Ch. 4.1 - Different notes on a trumpet are obtained by...Ch. 4.1 - If an instrument has four valves, there are 16...Ch. 4.1 - Assume that the registrar at your school is...Ch. 4.1 - Make up a scheduling problem that would be of some...Ch. 4.2 - Prob. 1ECh. 4.2 - Prob. 2ECh. 4.2 - Prob. 3ECh. 4.2 - Prob. 4ECh. 4.2 - Prob. 5ECh. 4.2 - Prob. 6ECh. 4.2 - Prob. 7ECh. 4.2 - Prob. 8ECh. 4.2 - How many Hamilton circuits are in K7?Ch. 4.2 - How many Hamilton circuits are in K8?Ch. 4.2 - Prob. 11ECh. 4.2 - Prob. 12ECh. 4.2 - Prob. 13ECh. 4.2 - Prob. 14ECh. 4.2 - Prob. 15ECh. 4.2 - Prob. 16ECh. 4.2 - Prob. 17ECh. 4.2 - Prob. 18ECh. 4.2 - Prob. 19ECh. 4.2 - Prob. 20ECh. 4.2 - Prob. 21ECh. 4.2 - Prob. 22ECh. 4.2 - Prob. 23ECh. 4.2 - Prob. 24ECh. 4.2 - In Exercises 23 -28, use the best edge algorithm...Ch. 4.2 - Prob. 26ECh. 4.2 - In Exercise 23 -28, use the best edge algorithm to...Ch. 4.2 - In Exercise 23 -28, use the best edge algorithm to...Ch. 4.2 - Simon Cowell plans a series of live shows from...Ch. 4.2 - ESPN is planning to do a special series called...Ch. 4.2 - Foodandwine.com states that the best ice cream...Ch. 4.2 - In order to try to solve a European financial...Ch. 4.2 - Prob. 33ECh. 4.2 - Prob. 34ECh. 4.2 - Prob. 35ECh. 4.2 - Prob. 36ECh. 4.2 - Prob. 37ECh. 4.2 - Prob. 38ECh. 4.2 - Prob. 39ECh. 4.2 - Prob. 40ECh. 4.2 - Prob. 41ECh. 4.2 - Prob. 42ECh. 4.2 - Prob. 43ECh. 4.2 - Prob. 44.1ECh. 4.2 - Prob. 44.2ECh. 4.2 - Prob. 45.1ECh. 4.2 - Prob. 45.2ECh. 4.2 - Prob. 45.3ECh. 4.2 - Prob. 49ECh. 4.2 - Prob. 51ECh. 4.2 - Prob. 52ECh. 4.3 - In Exercises 1-4, use each graph to find the...Ch. 4.3 - In Exercises 1-4, use each graph to find the...Ch. 4.3 - In Exercises 1-4, use each graph to find the...Ch. 4.3 - In Exercises 1-4, use each graph to find the...Ch. 4.3 - Prob. 5ECh. 4.3 - Prob. 6ECh. 4.3 - Prob. 7ECh. 4.3 - Prob. 8ECh. 4.3 - Modeling the spread of rumours. Ryan, Dwight, Pam,...Ch. 4.3 - Modeling the spread of classified information....Ch. 4.3 - Modeling the flow of paperwork through a...Ch. 4.3 - Modeling the spread of disease. The following...Ch. 4.3 - Prob. 13ECh. 4.3 - Modeling a communication network. An AMBER alert...Ch. 4.3 - Ranking football teams. The given graph shows the...Ch. 4.3 - Ranking American Gladiators. The graph below shows...Ch. 4.3 - Modeling influence. A designer who wishes to...Ch. 4.3 - Prob. 18ECh. 4.3 - Prob. 19ECh. 4.3 - Ranking CrossFit competitors. CrossFit is a...Ch. 4.3 - Prob. 21ECh. 4.3 - Prob. 22ECh. 4.3 - Prob. 23ECh. 4.3 - Prob. 24ECh. 4.3 - Prob. 25ECh. 4.3 - Prob. 26ECh. 4.3 - Prob. 27ECh. 4.3 - Prob. 28ECh. 4.3 - Prob. 29ECh. 4.3 - Communicating Mathematics In the incidence...Ch. 4.3 - Math in Your Life: Between the Numbers The history...Ch. 4.3 - Prob. 32ECh. 4.3 - Prob. 33ECh. 4.3 - Prob. 34ECh. 4.4 - Sharpening Your Skills. In Exercises 1 4, assume...Ch. 4.4 - Sharpening Your Skills. In Exercises 1 4, assume...Ch. 4.4 - Sharpening Your Skills. In Exercises 1 4, assume...Ch. 4.4 - Sharpening Your Skills. In Exercises 1 4, assume...Ch. 4.4 - Sharpening Your Skills. In Exercises 5 8, use the...Ch. 4.4 - Sharpening Your Skills. In Exercises 5 8, use the...Ch. 4.4 - Sharpening Your Skills. In Exercises 5 8, use the...Ch. 4.4 - Sharpening Your Skills. In Exercises 5 8, use the...Ch. 4.4 - Applying What Youve Learned. Planning a festival....Ch. 4.4 - Applying What Youve Learned. Organizing a project....Ch. 4.4 - Applying What Youve Learned. Building a student...Ch. 4.4 - Applying What Youve Learned. Organizing a health...Ch. 4.4 - Applying What Youve Learned. Organizing an...Ch. 4.4 - Communicating Mathematics. Study Figure 4.35 with...Ch. 4.4 - Communicating Mathematics. Write a brief report on...Ch. 4.4 - Challenge yourself. Planning an innovative house....Ch. 4.CR - Section 4.1 Use the preceding graph to answer the...Ch. 4.CR - Section 4.1 Explain how graphs are used to model a...Ch. 4.CR - Section 4.1 Which of the following graphs can be...Ch. 4.CR - Section 4.1 Use Fleurys algorithm to find an Euler...Ch. 4.CR - Section 4.1 Model the following street map with a...Ch. 4.CR - Prob. 6CRCh. 4.CR - Section 4.1 Allison, Branden, Colin, Donny, Erica,...Ch. 4.CR - Section 4.2 Find all Hamilton circuits that begin...Ch. 4.CR - Section 4.2 Use the following weighted graph to...Ch. 4.CR - Section 4.2 Use the following weighted graph to...Ch. 4.CR - Prob. 11CRCh. 4.CR - Prob. 12CRCh. 4.CR - Section 4.3 When are directed graphs rather than...Ch. 4.CR - Section 4.3 A student action committee has been...Ch. 4.CR - Section 4.4 Use the following PERT diagram to...Ch. 4.CR - Section 4.4 Congratulations You are planning your...Ch. 4.CT - Use the preceding graph to answer the following...Ch. 4.CT - Which of the following graphs can be traced? If a...Ch. 4.CT - Use Fleurys algorithm to find an Euler circuit in...Ch. 4.CT - Find all Hamilton circuits that begin at vertex A...Ch. 4.CT - Model the following street map with a graph and...Ch. 4.CT - Prob. 6CTCh. 4.CT - Use the following weighted graph to answer...Ch. 4.CT - Use the following weighted graph to answer...Ch. 4.CT - Use the following weighted graph to answer...Ch. 4.CT - Use the given directed graph to find the following...Ch. 4.CT - Use the given PERT diagram to answer the following...Ch. 4.CT - The following graph models one- and two-stage...
Knowledge Booster


Learn more about
Need a deep-dive on the concept behind this application? Look no further. Learn more about this topic, subject and related others by exploring similar questions and additional content below.Similar questions
- Answer question S8 stepwisearrow_forwardAnswer questions 8.2.11 and 8.2.12 respectivelyarrow_forward8.4.2 An article in Knee Surgery, Sports Traumatology, Arthroscopy [“Arthroscopic Meniscal Repair with an Absorbable Screw: Results and Surgical Technique” (2005, Vol. 13, pp. 273–279)] showed that only 25 out of 37 tears (67.6%) located between 3 and 6 mm from the meniscus rim were healed. a. Calculate a two-sided 95% confidence interval on the proportion of such tears that will heal. b. Calculate a 95% lower confidence bound on the proportion of such tears that will heal. 8.4.3 An article in the Journal of the American Statistical Association [“Illustration of Bayesian Inference in Normal Data Models Using Gibbs Sampling” (1990, Vol. 85, pp. 972–985)] measured the weight of 30 rats under experiment controls. Suppose that 12 were underweight rats. a. Calculate a 95% two-sided confidence interval on the true proportion of rats that would show underweight from the experiment. b. Using the point estimate of p obtained from the preliminary sample, what sample size is needed to be 95%…arrow_forward
- 8.4.8 Use the data from Exercise 8.4.2 to compute the two-sided Agresti-Coull CI on the proportion of tears that heal. Compare and discuss the relationship of this interval to the one computed in Exercise 8.4.2.arrow_forwardAnswer questions 8.3.7 and 8.4.1 respectivelyarrow_forwardDon't do 14. Please solve 19arrow_forward
- 8.4.7 Use the data from Exercise 8.4.5 to compute the two-sided Agresti-Coull CI on the proportion of digits read correctly. Compare and discuss the relationship of this interval to the one computed in Exercise 8.4.5.arrow_forward8.6.5 Consider the fuel rod enrichment data described in Exercise 8.2.11. Compute a 90% prediction interval on the enrichment of the next rod tested. Compare the length of the prediction interval with the length of the 99% CI on the population mean.arrow_forward8.4.4 The Arizona Department of Transportation wishes to survey state residents to determine what proportion of the population would like to increase statewide highway speed limits from 65 mph to 75 mph. How many residents does the department need to survey if it wants to be at least 99% confident that the sample proportion is within 0.05 of the true proportion? 8.4.5 The U.S. Postal Service (USPS) has used optical character recognition (OCR) since the mid-1960s. In 1983, USPS began deploying the technology to major post offices throughout the country (www.britannica.com). Suppose that in a random sample of 500 handwritten zip code digits, 466 were read correctly. a. Construct a 95% confidence interval for the true proportion of correct digits that can be automatically read. b. What sample size is needed to reduce the margin of error to 1%? c. How would the answer to part (b) change if you had to assume that the machine read only one-half of the digits correctly?arrow_forward
arrow_back_ios
SEE MORE QUESTIONS
arrow_forward_ios
Recommended textbooks for you
 Glencoe Algebra 1, Student Edition, 9780079039897...AlgebraISBN:9780079039897Author:CarterPublisher:McGraw Hill
 Holt Mcdougal Larson Pre-algebra: Student Edition...AlgebraISBN:9780547587776Author:HOLT MCDOUGALPublisher:HOLT MCDOUGAL
 Big Ideas Math A Bridge To Success Algebra 1: Stu...AlgebraISBN:9781680331141Author:HOUGHTON MIFFLIN HARCOURTPublisher:Houghton Mifflin Harcourt
 Algebra: Structure And Method, Book 1AlgebraISBN:9780395977224Author:Richard G. Brown, Mary P. Dolciani, Robert H. Sorgenfrey, William L. ColePublisher:McDougal Littell
Glencoe Algebra 1, Student Edition, 9780079039897...
Algebra
ISBN:9780079039897
Author:Carter
Publisher:McGraw Hill
Holt Mcdougal Larson Pre-algebra: Student Edition...
Algebra
ISBN:9780547587776
Author:HOLT MCDOUGAL
Publisher:HOLT MCDOUGAL
Big Ideas Math A Bridge To Success Algebra 1: Stu...
Algebra
ISBN:9781680331141
Author:HOUGHTON MIFFLIN HARCOURT
Publisher:Houghton Mifflin Harcourt
Algebra: Structure And Method, Book 1
Algebra
ISBN:9780395977224
Author:Richard G. Brown, Mary P. Dolciani, Robert H. Sorgenfrey, William L. Cole
Publisher:McDougal Littell
What Are Research Ethics?; Author: HighSchoolScience101;https://www.youtube.com/watch?v=nX4c3V23DZI;License: Standard YouTube License, CC-BY
What is Ethics in Research - ethics in research (research ethics); Author: Chee-Onn Leong;https://www.youtube.com/watch?v=W8Vk0sXtMGU;License: Standard YouTube License, CC-BY