Concept explainers
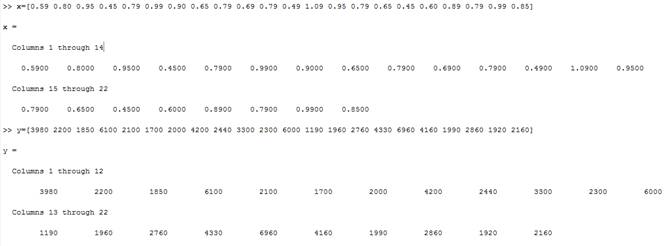
5. A company test-markets a new soft drink in 22 cities of approximately equal size. The selling price (in dollars) and the number sold per week in the cities are listed as follows:


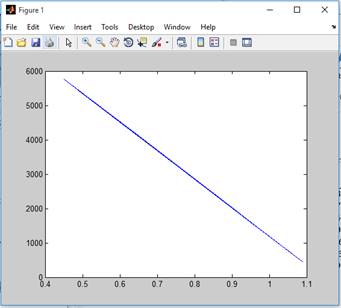
a. First, the company wants to find the demand curve1: how many it will sell at each potential price. Let P denote price and S denote sales per week. Find the line
b. After studying the results of the test marketing, the company will set a single selling price P throughout the country. Given a manufacturing cost of
dollars. Use the results of the preceding least squares approximation to find the selling price for which the company’s profit will be maximized.
Want to see the full answer?
Check out a sample textbook solution
Chapter 4 Solutions
Numerical Analysis
- Solve questions by Course Name (Ordinary Differential Equations II 2)arrow_forwardd((x, y), (z, w)) = |xz|+|yw|, show that whether d is a metric on R² or not?. Q3/Let R be a set of real number and d: R² x R² → R such that -> d((x, y), (z, w)) = max{\x - zl, ly - w} show that whether d is a metric on R² or not?. Q4/Let X be a nonempty set and d₁, d₂: XXR are metrics on X let d3,d4, d5: XX → R such that d3(x, y) = 4d2(x, y) d4(x, y) = 3d₁(x, y) +2d2(x, y) d5(x,y) = 2d₁ (x,y))/ 1+ 2d₂(x, y). Show that whether d3, d4 and d5 are metric on X or not?arrow_forwardplease Solve questions by Course Name( Ordinary Differential Equations II 2)arrow_forward
- Business discussarrow_forwardplease do Q3arrow_forwardUse the properties of logarithms, given that In(2) = 0.6931 and In(3) = 1.0986, to approximate the logarithm. Use a calculator to confirm your approximations. (Round your answers to four decimal places.) (a) In(0.75) (b) In(24) (c) In(18) 1 (d) In ≈ 2 72arrow_forward
- Find the indefinite integral. (Remember the constant of integration.) √tan(8x) tan(8x) sec²(8x) dxarrow_forwardFind the indefinite integral by making a change of variables. (Remember the constant of integration.) √(x+4) 4)√6-x dxarrow_forwardInThe Northern Lights are bright flashes of colored light between 50 and 200 miles above Earth. Suppose a flash occurs 150 miles above Earth. What is the measure of arc BD, the portion of Earth from which the flash is visible? (Earth’s radius is approximately 4000 miles.)arrow_forward
 Elementary AlgebraAlgebraISBN:9780998625713Author:Lynn Marecek, MaryAnne Anthony-SmithPublisher:OpenStax - Rice University
 Functions and Change: A Modeling Approach to Coll...AlgebraISBN:9781337111348Author:Bruce Crauder, Benny Evans, Alan NoellPublisher:Cengage Learning
 Elementary Geometry For College Students, 7eGeometryISBN:9781337614085Author:Alexander, Daniel C.; Koeberlein, Geralyn M.Publisher:Cengage,
 Glencoe Algebra 1, Student Edition, 9780079039897...AlgebraISBN:9780079039897Author:CarterPublisher:McGraw Hill
 Trigonometry (MindTap Course List)TrigonometryISBN:9781337278461Author:Ron LarsonPublisher:Cengage Learning
 Holt Mcdougal Larson Pre-algebra: Student Edition...AlgebraISBN:9780547587776Author:HOLT MCDOUGALPublisher:HOLT MCDOUGAL


