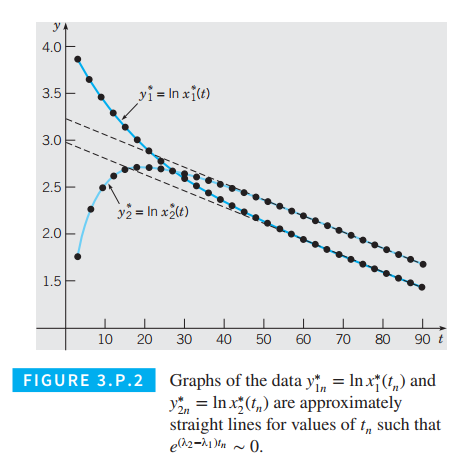
Table 3.P.1 lists drug concentration measurements made in blood and tissue compartments over a period of
TABLE 3.P.1 Compartment concentration measurements.
Estimating Eigenvalues and Eigenvectors of
respectively. The solution of Eq. (1) can be expressed as
where
(a) For values of
Given that both components of the data

Computing the Entries of
and
or, using matrix notation,
Given estimates
Want to see the full answer?
Check out a sample textbook solution
Chapter 3 Solutions
Differential Equations: An Introduction to Modern Methods and Applications
Additional Math Textbook Solutions
Pre-Algebra Student Edition
Calculus for Business, Economics, Life Sciences, and Social Sciences (14th Edition)
Basic Business Statistics, Student Value Edition
A Problem Solving Approach To Mathematics For Elementary School Teachers (13th Edition)
A First Course in Probability (10th Edition)
Intro Stats, Books a la Carte Edition (5th Edition)
- Question 3. A manufacturer has modeled its yearly production function P (the value of its entire production, in millions of dollars) as a Cobb-Douglas function P(L, K) = 1.47L0.65 0.35 where L is the number of labor hours (in thousands) and K is the invested capital (in millions of dollars). ӘР Ət (a) Express the rate of change of production 07-2 in time, in terms of the rate of change of the labor force and the rate of change of the capital in time. (b) Suppose that when L = 30 and K = 8, the labor force is decreasing at a rate of 2000 labor hours per year and capital is increasing at a rate of 500,000 per year. What is the rate of change of production per year?arrow_forward17. Consider a mass-spring system that satisfies 2y′′(t) + by′(t) + 50y(t) = 0.Which of the following is/are true?(i) If b = 0, the motion is critically damped with period π/5 .(ii) If b = 12, the motion is underdamped.(iii) If b = 40, the motion is overdamped.A. (ii) and (iii) only B. (ii) only C. (i) and (ii) only D. (i) and (iii) only E. Allarrow_forward20. Find the general solution to the differential equation y(4) − 8y′′ + 16y = 0A. y = c1e^2x + c2e^−2xB. y = c1xe^2x + c2xe^−2xC. y = c1e^2x + c2e^−2x + c3xe^2x + c4xe^−2xD. y = c1xe^2x + c2xe^−2x + c3x^2e^2x + c4x^2e^−2xE. y = c1 cos 2x + c2 sin 2x + c3x cos 2x + c4x sin 2xarrow_forward
- 9. A 1 kg mass is attached to a spring with constant 13 N/m. The system is immersed in amedium which offers a damping force numerically equal to 6 times the instantaneous velocity.If x is the displacement of the mass from equilibrium, measured in meters,then x′′ + 6x′ + 13x = 0 . Which of the following statements is true?A. x(t) = c1e^−t + c2e^−5t, and the system is underdamped.B. x(t) = c1e^−t + c2e^−5t, and the system is overdamped.C. x(t) = c1e^−3t cos(2t) + c2e^−3t sin(2t), and the system is underdamped.D. x(t) = c1e^−3t cos(2t) + c2e^−3t sin(2t), and the system is overdamped.arrow_forwardQuestion 2 (A partial differential equation). The diffusion equation де Ət = 82 с მx2 where D is a positive constant, describes the diffusion of heat through a solid, or the concentration of a pollutant at time t at a distance x from the source of the pollution, or the invasion of alien species into a new habitat. Verify that the function c(x, t) -x²/(4Dt) = √4πDt is a solution of the diffusion equation.arrow_forward13. Let y(x) be the solution to the initial value problem y′′ − 10y′ + 25y = 0, y(0) = 1, y′(0) = 3.Then y(1) = ? A. −e^5 B. 1 C. e^5 D. 4/5 e^5 + 1/5 e^−5 E. e^−5arrow_forward
- Question 1 (Implicit differentiation). Use implicit differentiation to find Əz/Əx and Əz/ǝy. (a) x²+2y²+3z² 1 (b) ez = xyz (c) x2. y²+ z² − 2z = 4 (d) yz+xln(y) = z²arrow_forward4. The general solution of the differential equation y′′ + 2y′ + 5y = 0 isA. c1 + c2x B. c1 cos 2x + c2 sin 2x C. c1e^x cos 2x + c2e^x sin 2xD. c1e^−x cos 2x + c2e^−x sin 2x E. None of these.arrow_forwardwhy the know-show table below is not valid: I know something is wrong in the step p2-p5 but I don't know how to explain it. Can you explain why please.arrow_forward
- 3. The general solution of the differential equation y′′ + 2y′ + y = 0 isA. c1e^−x + c2e^−x B. c1e^−x + c2e^x C. c1e^−x + c2xe^−xD. c1 cos x + c2 sin x E. c1e^−xarrow_forward1. A solution to the differential equation y′′ + 4y′ + 13y = 0 isA. y(t) = e^2t cos 3t B. y(t) = te^2t cos 3t C. y(t) = e^−2t sin 3t D. None of thesearrow_forward2. The appropriate guess for the particular solution to the differential equationy′′ + 3y′ + 2y = 2x + 3e^−x isA. A + Bx + Ce^−x B. A + Bx + Cxe^−x C. Ax + Bx^2 + Ce−^x D. Ax + Bx^2 + Cxe^−xarrow_forward
 Linear Algebra: A Modern IntroductionAlgebraISBN:9781285463247Author:David PoolePublisher:Cengage Learning
