
Concept explainers
Videos
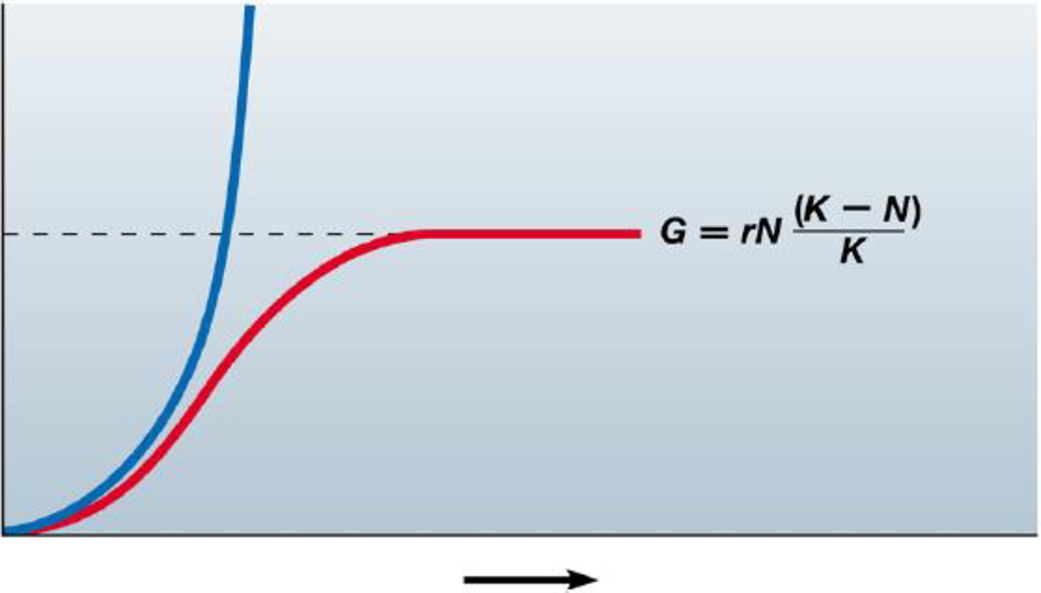
Use this graph of the idealized exponential and
a. Label the axes and curves on the graph.
b. Give the formula that describes the blue curve.
c. What does the dotted line represent?
d. For each curve, indicate and explain where population growth is the most rapid.
e. Which of these curves best represents global human population growth?
a.
To label: The axis and the curves of the graph.
Introduction: Exponential growth curve is the J-shaped curve that is ever increasing in nature. The logistic growth curve is an S shaped curve in which the growth of the population ceases after a certain point which can be represented as the carrying capacity of the population.
Answer to Problem 1CC
Correct answer:
X-axis is time, Y-axis is population size. Blue/thick curve is the exponential growth and red/thin curve is logistic curve
Explanation of Solution
Graphical representation: Fig: 1 shows the graph depicting the logistic and exponential growth curve.
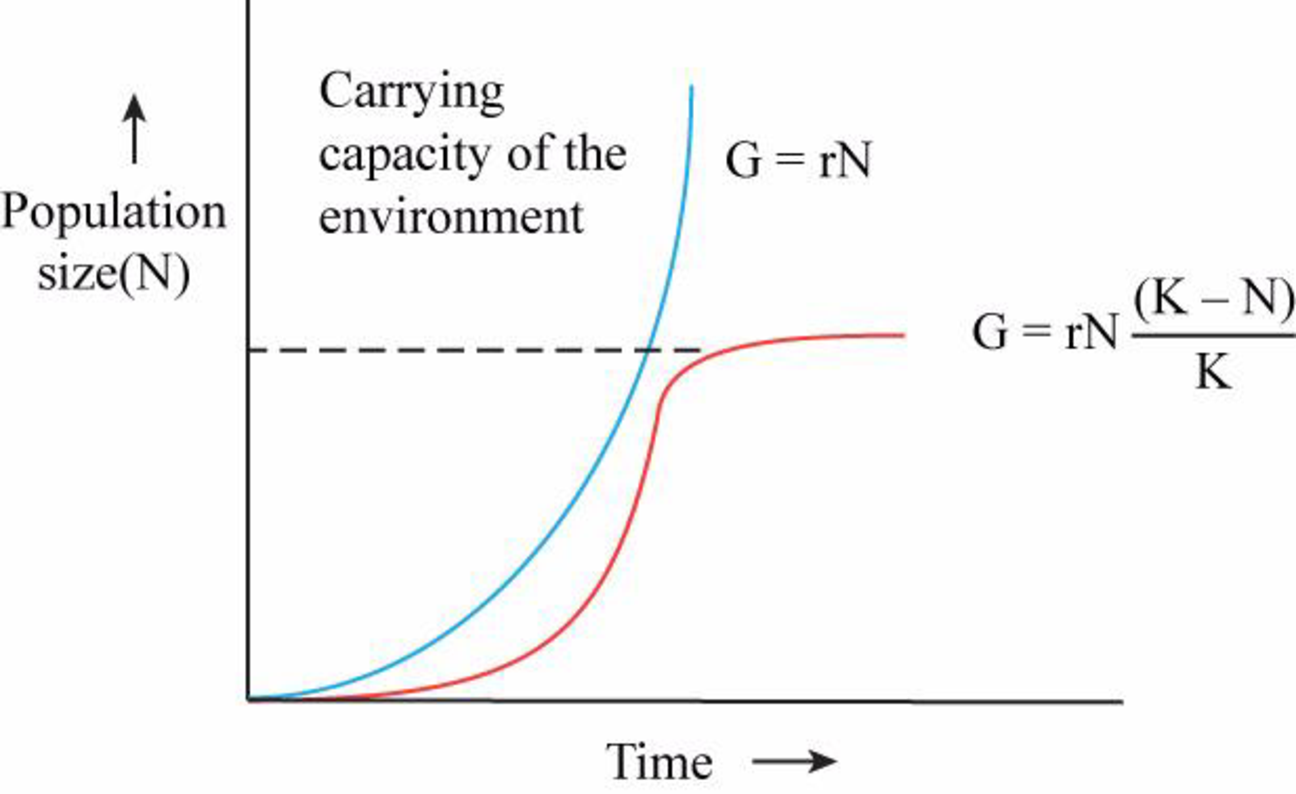
Fig. 1: The graph depicting the logistic and exponential growth curve.
The X-axis of the graph represents the time taken for growth and the Y-axis of the graph represents the size of the population. The blue/thick curve is the exponential growth curve and red/thin curve is logistic growth curve. Hence the correct answer is X-axis is time, Y-axis is population size. Blue/thick curve is the exponential growth and red/thin curve is logistic curve
b.
To give: The formula that describes the blue curve.
Answer to Problem 1CC
Correct answer:
Explanation of Solution
Refer to Fig.1; the blue curve can be described by the formula
c.
To determine: What does the dotted line represents.
Answer to Problem 1CC
Correct answer:
Carrying capacity of the environment (K)
Explanation of Solution
Refer to Fig.1; the dotted line represented on the graph is the carrying capacity of the environment. Hence the correct answer is carrying capacity of the environment (K)
d.
To determine: What does each curve represents.
Answer to Problem 1CC
Correct answer:
Population of logistic curve is most rapid at half of the carrying capacity. Population of exponential growth is most rapid throughout the curve as it is continuously increasing.
Explanation of Solution
Refer to Fig.1; the population growth is most rapid when population attains half of the carrying capacity in logistic curve and the population growth is continuously increasing in the exponential growth curve. Hence the correct answer half of the carrying capacity in logistic curve and continuous growth in exponential growth.
e.
To determine: The curve which represents the global human population.
Answer to Problem 1CC
Correct answer:
Exponential growth curve
Explanation of Solution
Refer to Fig.1; it is the J shaped curve that is continuously increasing is the exponential growth curve. The worldwide population can be represented by this curve as the population is ever increasing. Hence the correct answer is exponential growth curve.
Want to see more full solutions like this?
Chapter 36 Solutions
CAMP.BIO:CONC...MOD.MAST+PRINT>I<


- I'm struggling with this topic and would really appreciate your help. I need to hand-draw a diagram and explain the process of sexual differentiation in humans, including structures, hormones, enzymes, and other details. Could you also make sure to include these terms in the explanation? . Gonads . Wolffian ducts • Müllerian ducts . ⚫ Testes . Testosterone • Anti-Müllerian Hormone (AMH) . Epididymis • Vas deferens ⚫ Seminal vesicles ⚫ 5-alpha reductase ⚫ DHT - Penis . Scrotum . Ovaries • Uterus ⚫ Fallopian tubes - Vagina - Clitoris . Labia Thank you so much for your help!arrow_forwardRequisition Exercise A phlebotomist goes to a patient’s room with the following requisition. Hometown Hospital USA 125 Goodcare Avenue Small Town, USAarrow_forwardI’m struggling with this topic and would really appreciate your help. I need to hand-draw a diagram and explain the process of sexual differentiation in humans, including structures, hormones, enzymes, and other details. Could you also make sure to include these terms in the explanation? • Gonads • Wolffian ducts • Müllerian ducts • Testes • Testosterone • Anti-Müllerian Hormone (AMH) • Epididymis • Vas deferens • Seminal vesicles • 5-alpha reductase • DHT • Penis • Scrotum • Ovaries • Uterus • Fallopian tubes • Vagina • Clitoris • Labia Thank you so much for your help!arrow_forward
- I’m struggling with this topic and would really appreciate your help. I need to hand-draw a diagram and explain the process of sexual differentiation in humans, including structures, hormones, enzymes, and other details. Could you also make sure to include these terms in the explanation? • Gonads • Wolffian ducts • Müllerian ducts • Testes • Testosterone • Anti-Müllerian Hormone (AMH) • Epididymis • Vas deferens • Seminal vesicles • 5-alpha reductase • DHT • Penis • Scrotum • Ovaries • Uterus • Fallopian tubes • Vagina • Clitoris • Labia Thank you so much for your help!arrow_forwardOlder adults have unique challenges in terms of their nutrient needs and physiological changes. Some changes may make it difficult to consume a healthful diet, so it is important to identify strategies to help overcome these obstacles. From the list below, choose all the correct statements about changes in older adults. Select all that apply. Poor vision can make it difficult for older adults to get to a supermarket, and to prepare meals. With age, taste and visual perception decline. As people age, salivary production increases. In older adults with dysphagia, foods like creamy soups, applesauce, and yogurt are usually well tolerated. Lean body mass increases in older adults.arrow_forwardWhen physical activity increases, energy requirements increase also. Depending on the type, intensity, and duration of physical activity, the body’s requirements for certain macronutrients may change as well. From the list below, choose all the correct statements about the effects of increased physical activity or athletic training. Select all that apply. An athlete who weighs 70 kg (154 lb) should consume 420 to 700 g of carbohydrate per day. How much additional energy an athlete needs depends on the specific activity the athlete engages in and the frequency of the activity. Those participating in vigorous exercise should restrict their fat intake to less than 15%% of total energy intake. Athletes who are following energy-restricted diets are at risk for consuming insufficient protein. The recommendation to limit saturated fat intake to less than 10%% of total energy intake does not apply to athletes or those who regularly engage in vigorous physical activity.arrow_forward
- When taking vitamins and vitamin-mineral supplements, how can one be sure they are getting what they are taking?arrow_forwardHow many milligrams of zinc did you consume on average per day over the 3 days? (See the Actual Intakes vs. Recommended Intakes Report with all days checked.) Enter the number of milligrams of zinc rounded to the first decimal place in the box below. ______ mg ?arrow_forwardthe direct output from molecular replacement is a coordinate file showing the orientation of the unknown target protein in the unit cell. true or false?arrow_forward
- the direct output from molecular replacement is a coordinate file showing the orientation of the unknown target protein in the unit cell. true or false?arrow_forwardDid your intake of vitamin C meet or come very close to the recommended amount? yes noarrow_forwardWhich of the following statements about hydration is true? Absence of thirst is a reliable indication that an individual is adequately hydrated. All of these statements are true. Although a popular way to monitor hydration status, weighing yourself before and after intensive physical activity is not a reliable method to monitor hydration. Urine that is the color of apple juice indicates dehydration. I don't know yetarrow_forward
 Case Studies In Health Information ManagementBiologyISBN:9781337676908Author:SCHNERINGPublisher:Cengage
 Biology (MindTap Course List)BiologyISBN:9781337392938Author:Eldra Solomon, Charles Martin, Diana W. Martin, Linda R. BergPublisher:Cengage Learning
 Concepts of BiologyBiologyISBN:9781938168116Author:Samantha Fowler, Rebecca Roush, James WisePublisher:OpenStax College
 Biology 2eBiologyISBN:9781947172517Author:Matthew Douglas, Jung Choi, Mary Ann ClarkPublisher:OpenStax
 Principles Of Radiographic Imaging: An Art And A ...Health & NutritionISBN:9781337711067Author:Richard R. Carlton, Arlene M. Adler, Vesna BalacPublisher:Cengage Learning