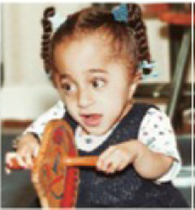
Building Better Bones Tiffany, shown in FIGURE 35.22, was born with multiple fractures in her arms and legs. By age six, she had undergone surgery to correct more than 200 bone fractures. Her fragile, easily broken bones are symptoms of osteogenesis imperfecta (OI), a genetic disorder caused by a mutation in a gene for collagen. As bones develop, collagen forms a scaffold for deposition of mineralized bone tissue. The scaffold forms improperly in children with OI. FIGURE 35.22 also shows the results of a test of a new drug. Treated children, all less than two years old, were compared to similarly affected children of the same age who were not treated with the drug.
| Vertebral | |||
| Treated | area in cm2 | Fractures | |
| child | (Initial) | (Final) | per year |
| 1 | 14.7 | 16.7 | 1 |
| 2 | 15.5 | 16.9 | 1 |
| 3 | 6.7 | 16.5 | 6 |
| 4 | 7.3 | 11.8 | 0 |
| 5 | 13.6 | 14.6 | 6 |
| 6 | 9.3 | 15.6 | 1 |
| 7 | 15.3 | 15.9 | 0 |
| 8 | 9.9 | 13.0 | 4 |
| 9 | 10.5 | 13.4 | 4 |
| Mean | 11.4 | 14.9 | 2.6 |
| Vertebral | |||
| Treated | area in cm2 | Fractures | |
| child | (Initial) | (Final) | per year |
| 1 | 18.2 | 13.7 | 4 |
| 2 | 16.5 | 12.9 | 7 |
| 3 | 16.4 | 11.3 | 8 |
| 4 | 13.5 | 7.7 | 5 |
| 5 | 16.2 | 16.1 | 8 |
| 6 | 18.9 | 17.0 | 6 |
| Mean | 16.6 | 13.1 | 6.3 |

FIGURE 35.22 Results of a clinical trial of a drug treatment for osteogenesis imperfecta (OI), which affects the child shown at right. Nine children with OI received the drug. Six others were untreated controls. Surface area of certain vertebrae was measured before and after treatment. Fractures occurring during the 12 months of the trial were also recorded.
4. Do these results shown support the hypothesis that this drug, which slows bone breakdown, can increase bone growth and reduce fractures in young children with OI?
Want to see the full answer?
Check out a sample textbook solution
Chapter 35 Solutions
Bundle: Biology: The Unity and Diversity of Life, Loose-leaf Version, 14th + LMS Integrated for MindTap Biology, 2 terms (12 months) Printed Access Card
- Molecular Biology Question. Please help solve. Thanks. Please draw how two nucleotide triphosphates are linked together to form a dinucleotide, and label the 5' and 3' ends of the resulting dinucleotide.arrow_forwardWhat is a reversion in molecular biology?arrow_forwardWhat is a gain of function mutation?arrow_forward
- Molecular Biology Question: Please help. Thank you Is Southern hybridization's purpose detecting specific nucleotide sequences? How so?arrow_forwardUse the following information to answer the question(s) below. Martin Wikelski and L. Michael Romero (Body size, performance and fitness in Galápagos marine iguanas, Integrative and Comparative Biology 43 [2003]:376-86) measured the snout-to-vent (anus) length of Galápagos marine iguanas and observed the percent survival of different-sized animals, all of the same age. The graph shows the log snout-vent length (SVL, a measure of overall body size) plotted against the percent survival of these different size classes for males and females. Survival (%) 100- 80- 60- 40- 20- 0+ 1.9 T 2 2.1 2.2 2.3 2.4 2.5 2.6 2.7 Log SVL (mm) 19) Examine the figure above. What type of selection for body size appears to be occurring in these marine iguanas? A) directional selection B) stabilizing selection C) disruptive selection D) You cannot determine the type of selection from the above information. 3arrow_forward24) Use the following information to answer the question below. Researchers studying a small milkweed population note that some plants produce a toxin and other plants do not. They identify the gene responsible for toxin production. The dominant allele (T) codes for an enzyme that makes the toxin, and the recessive allele (t) codes for a nonfunctional enzyme that cannot produce the toxin. Heterozygotes produce an intermediate amount of toxin. The genotypes of all individuals in the population are determined (see table) and used to determine the actual allele frequencies in the population. TT 0.49 Tt 0.42 tt 0.09 Refer to the table above. Is this population in Hardy-Weinberg equilibrium? A) Yes. C) No; there are more homozygotes than expected. B) No; there are more heterozygotes than expected. D) It is impossible to tell.arrow_forward
- 30) A B CDEFG Refer to the accompanying figure. Which of the following forms a monophyletic group? A) A, B, C, and D B) C and D C) D, E, and F D) E, F, and Garrow_forwardMolecular Biology Question. Please help with step solution and explanation. Thank you: The Polymerase Chain Reaction (PCR) reaction consists of three steps denaturation, hybridization, and elongation. Please describe what occurs in the annealing step of the PCR reaction. (I think annealing step is hybridization). What are the other two steps of PCR, and what are their functions? Next, suppose the Tm for the two primers being used are 54C for Primer A and 67C for Primer B. Regarding annealing step temperature, I have the following choices for the temperature used during the annealing step:(a) 43C (b) 49C (c) 62C (d) 73C Which temperature/temperatures should I choose? What is the corresponding correct explanation, and why would I not use the other temperatures? Have a good day!arrow_forwardUsing the data provided on the mean body mass and horn size of 4-year-old male sheep, draw a scatterplot graph to examine how body mass and horn size changed over time.arrow_forward
- Please write a 500-word report about the intake of saturated fat, sodium, alcoholic beverages, or added sugar in America. Choose ONE of these and write about what is recommended by the Dietary Guidelines for Americans (guideline #4) and why Americans exceed the intake of that nutrient. Explain what we could do as a society and/or individuals to reduce our intake of your chosen nutrient.arrow_forwardWrite a 500-word report indicating how you can change the quantity or quality of TWO nutrients where your intake was LOWER than what is recommended by the Dietary Guidelines for Americans and/or the DRIs. Indicate how the lack of the nutrient may affect your health. For full credit, all of the following points must be addressed and elaborated on in more detail for each nutrient: The name of the nutrient At least 2 main functions of the nutrient (example: “Vitamin D regulates calcium levels in the blood and calcification of bones.”) Your percent intake compared to the RDA/DRI (example “I consumed 50% of the RDA for vitamin D”) Indicate why your intake was below the recommendations (example: “I only had one serving of dairy products and that was why I was below the recommendations for vitamin D”) How would you change your dietary pattern to meet the recommendations? – be sure to list specific foods (example: “I would add a yogurt and a glass of milk to each day in order to increase my…arrow_forwardWhy are nutrient absorption and dosage levels important when taking multivitamins and vitamin and mineral supplements?arrow_forward
 Biology: The Dynamic Science (MindTap Course List)BiologyISBN:9781305389892Author:Peter J. Russell, Paul E. Hertz, Beverly McMillanPublisher:Cengage Learning
 Anatomy & PhysiologyBiologyISBN:9781938168130Author:Kelly A. Young, James A. Wise, Peter DeSaix, Dean H. Kruse, Brandon Poe, Eddie Johnson, Jody E. Johnson, Oksana Korol, J. Gordon Betts, Mark WomblePublisher:OpenStax College
 Biology: The Unity and Diversity of Life (MindTap...BiologyISBN:9781305073951Author:Cecie Starr, Ralph Taggart, Christine Evers, Lisa StarrPublisher:Cengage Learning
 Biology 2eBiologyISBN:9781947172517Author:Matthew Douglas, Jung Choi, Mary Ann ClarkPublisher:OpenStax
 Biology: The Unity and Diversity of Life (MindTap...BiologyISBN:9781337408332Author:Cecie Starr, Ralph Taggart, Christine Evers, Lisa StarrPublisher:Cengage Learning
 Principles Of Radiographic Imaging: An Art And A ...Health & NutritionISBN:9781337711067Author:Richard R. Carlton, Arlene M. Adler, Vesna BalacPublisher:Cengage Learning


