Concept explainers
Videos
a.
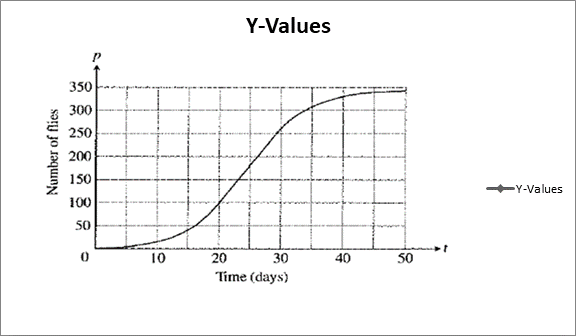
To graph: the derivative of the fruit fly population. The graph of the population is reproduced below and what units should be used on the horizontal and vertical axes for the derivative’s graph.
a.
Answer to Problem 7E
The units for derivative graph are days for horizontal axis (x-axis) and flies per day for the vertical axis (y-axis).
Explanation of Solution
Given information: Populations starting out in closed environments grow slowly at first, when there are relatively few members, then more rapidly as the number of reproducing individual increases and resources are still abundant , then slowly again as the population reaches the carrying capacity of the environment. The graph of the population is reproduced is given below.
Calculation:
Estimate the slopes at x =0, 10, and 20,30,40,50 by drawing tangent lines at each value:
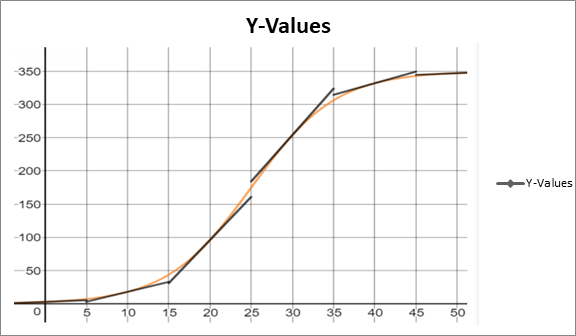
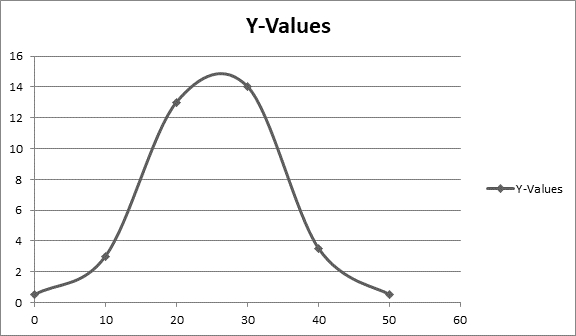
The estimated slopes of the tangent lines are about 0.5 for t =0, 3 for t =10, 13 for t =20, 14 for t =30, 3.5 for t =40, and 0.5 for t =50. The points on the graph of the derivative are then about (0,0.5),(10,3),(20,13),(30,14),(40,3.5), and (50,0.5). Plot these points and connect them with a smooth curve to make the graph of the derivative :
Since the dependent variable for the original graph was flies and the independent variable was days, the units for derivative graph are days for horizontal axis(x-axis) and flies per day for the vertical axis (y-axis).
b.
To find: during what days does the population seem to be increasing fastest, slowest.
b.
Answer to Problem 7E
Fastest: Day 25 and Slowest: Day 0 or Day 50.
Explanation of Solution
Given information: Populations starting out in closed environments grow slowly at first, when there are relatively few members, then more rapidly as the number of reproducing individual increases and resources are still abundant , then slowly again as the population reaches the carrying capacity of the environment. The graph of the population is reproduced is given below.

Calculation:
The derivative graph is shown below.

From the derivative graph, the maximum of the derivative graph was around t =25.
So, Increasing the fastest: Around the 25th day.
From the derivative graph, the minimum of the derivative graph was around t =0 and t =50.
So, increasing the slowest: Day 0 or Day 50.
Chapter 3 Solutions
Calculus: Graphical, Numerical, Algebraic
Additional Math Textbook Solutions
Calculus: Early Transcendentals (2nd Edition)
Elementary Statistics (13th Edition)
Elementary Statistics: Picturing the World (7th Edition)
Algebra and Trigonometry (6th Edition)
Basic Business Statistics, Student Value Edition
A First Course in Probability (10th Edition)


- Prove 11.1.2arrow_forward39. (a) Show that Σeak converges for each α > 0. (b) Show that keak converges for each a > 0. k=0 (c) Show that, more generally, Σk"eak converges for each k=0 nonnegative integer n and each a > 0.arrow_forward#3 Find the derivative y' = of the following functions, using the derivative rules: dx a) y-Cos 6x b) y=x-Sin4x c) y=x-Cos3x d) y=x-R CD-X:-:TCH :D:D:D - Sin f) Sin(x²) (9) Tan (x³)arrow_forward
 Calculus: Early TranscendentalsCalculusISBN:9781285741550Author:James StewartPublisher:Cengage Learning
 Thomas' Calculus (14th Edition)CalculusISBN:9780134438986Author:Joel R. Hass, Christopher E. Heil, Maurice D. WeirPublisher:PEARSON
 Calculus: Early Transcendentals (3rd Edition)CalculusISBN:9780134763644Author:William L. Briggs, Lyle Cochran, Bernard Gillett, Eric SchulzPublisher:PEARSON
 Calculus: Early TranscendentalsCalculusISBN:9781319050740Author:Jon Rogawski, Colin Adams, Robert FranzosaPublisher:W. H. Freeman
 Calculus: Early Transcendental FunctionsCalculusISBN:9781337552516Author:Ron Larson, Bruce H. EdwardsPublisher:Cengage Learning