Concept explainers
(a)
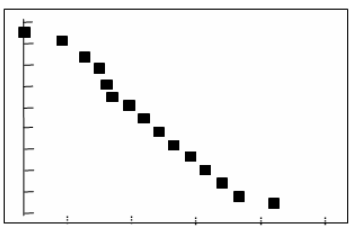
To find: The sketch for the graph of the elevation ( y ) as the function of the distance downriver ( x ).
(a)
Answer to Problem 30E
The sketch of the graph is shown in Figure 1.
Explanation of Solution
Given Data:
The given table is shown in Table 1.
Table 1
| Distance down river in miles | River Elevation Feet |
| 0.00 | 1577 |
| 0.56 | 1512 |
| 0.92 | 1448 |
| 1.19 | 1384 |
| 1.30 | 1319 |
| 1.39 | 1255 |
| 1.57 | 1191 |
| 1.74 | 1126 |
| 1.98 | 1062 |
| 2.18 | 998 |
| 2.41 | 933 |
| 2.64 | 869 |
| 3.24 | 805 |
Calculation:
From the given table the graph of the data is shown in Figure 1.

Figure 1
In the above figure the x is the distance down the river and the y is the river elevation.
(b)
To find: The approximate graph of the given data.
(b)
Answer to Problem 30E
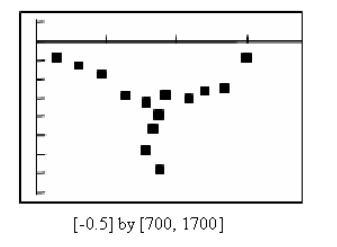
The required graph is shown in Figure 2.
Explanation of Solution
Consider the formula for the midpoint is,
The formula for the slope is,
Then, form the table 1 the table for the mid-point interval and the slope is shown in Table 2
Table 2
| Midpoint of the interval | Slope |
| 0.28 | -116.07 |
| 0.74 | -177.78 |
| 1.055 | -237.04 |
| 1.245 | -590.91 |
| 1.345 | -711.11 |
| 1.48 | -355.56 |
| 1.655 | -382.35 |
| 1.86 | -266.67 |
| 2.08 | -320.00 |
| 2.295 | -282.61 |
| 2.525 | -278.26 |
| 2.94 | -106.67 |
From the above data the approximate graph is shown in Figure 2

Figure 2
(c)
To find: The unit measure of the gradient.
(c)
Answer to Problem 30E
The unit of the gradient is in feet per mile.
Explanation of Solution
Consider the formula for the gradient is,
Since, the value of the elevation is feet and the distance down the river is in miles the unit of the gradient is in feet per mile.
(d)
To find: The unit measure that is appropriate for the derivative.
(d)
Answer to Problem 30E
The unit of derivative are feet per mile.
Explanation of Solution
The derivative is given by,
Here, y is the elevation that is in feet.
The distance is
The unit of derivative are feet per mile.
(e)
To find: The identification of the most dangerous section of the river by analysing the graph of part (a)
(e)
Answer to Problem 30E
The points where the change is the river elevation causes rapid increase in the speed of the river flow and this is the most dangerous section of the river.
Explanation of Solution
The steepest part of the curve and in this way the elevation drops rapidly and the most likely location for significant rapids. The points where the change is the river elevation causes rapid increase in the speed of the river flow and this is the most dangerous section of the river.
(f)
To find: The way in which the most dangerous section of the river is identified by the analysing the graph in ( b ) Explain.
(f)
Answer to Problem 30E
The lowest point is the point where there is signification change in depth and hence it is the most dangerous section of the river.
Explanation of Solution
The lowest point on the graph is the point where the elevation drops most rapidly and therefore the most likely location of the significant rapids.
Thus, the lowest point is the point where there is signification change in depth and hence it is the most dangerous section of the river.
Chapter 3 Solutions
Calculus: Graphical, Numerical, Algebraic
Additional Math Textbook Solutions
A First Course in Probability (10th Edition)
Intro Stats, Books a la Carte Edition (5th Edition)
College Algebra with Modeling & Visualization (5th Edition)
Elementary Statistics (13th Edition)
Calculus for Business, Economics, Life Sciences, and Social Sciences (14th Edition)
- Prove 11.1.2arrow_forward39. (a) Show that Σeak converges for each α > 0. (b) Show that keak converges for each a > 0. k=0 (c) Show that, more generally, Σk"eak converges for each k=0 nonnegative integer n and each a > 0.arrow_forward#3 Find the derivative y' = of the following functions, using the derivative rules: dx a) y-Cos 6x b) y=x-Sin4x c) y=x-Cos3x d) y=x-R CD-X:-:TCH :D:D:D - Sin f) Sin(x²) (9) Tan (x³)arrow_forward
 Calculus: Early TranscendentalsCalculusISBN:9781285741550Author:James StewartPublisher:Cengage Learning
 Thomas' Calculus (14th Edition)CalculusISBN:9780134438986Author:Joel R. Hass, Christopher E. Heil, Maurice D. WeirPublisher:PEARSON
 Calculus: Early Transcendentals (3rd Edition)CalculusISBN:9780134763644Author:William L. Briggs, Lyle Cochran, Bernard Gillett, Eric SchulzPublisher:PEARSON
 Calculus: Early TranscendentalsCalculusISBN:9781319050740Author:Jon Rogawski, Colin Adams, Robert FranzosaPublisher:W. H. Freeman
 Calculus: Early Transcendental FunctionsCalculusISBN:9781337552516Author:Ron Larson, Bruce H. EdwardsPublisher:Cengage Learning


