
Videos
Consumer Reports (consumerreports.org) rated 37 different models of laptops that were for sale in 2015. An overall score was assigned to each model based on consideration of several factors, including performance, portability, and battery life. Data on price and overall score were used to construct the following
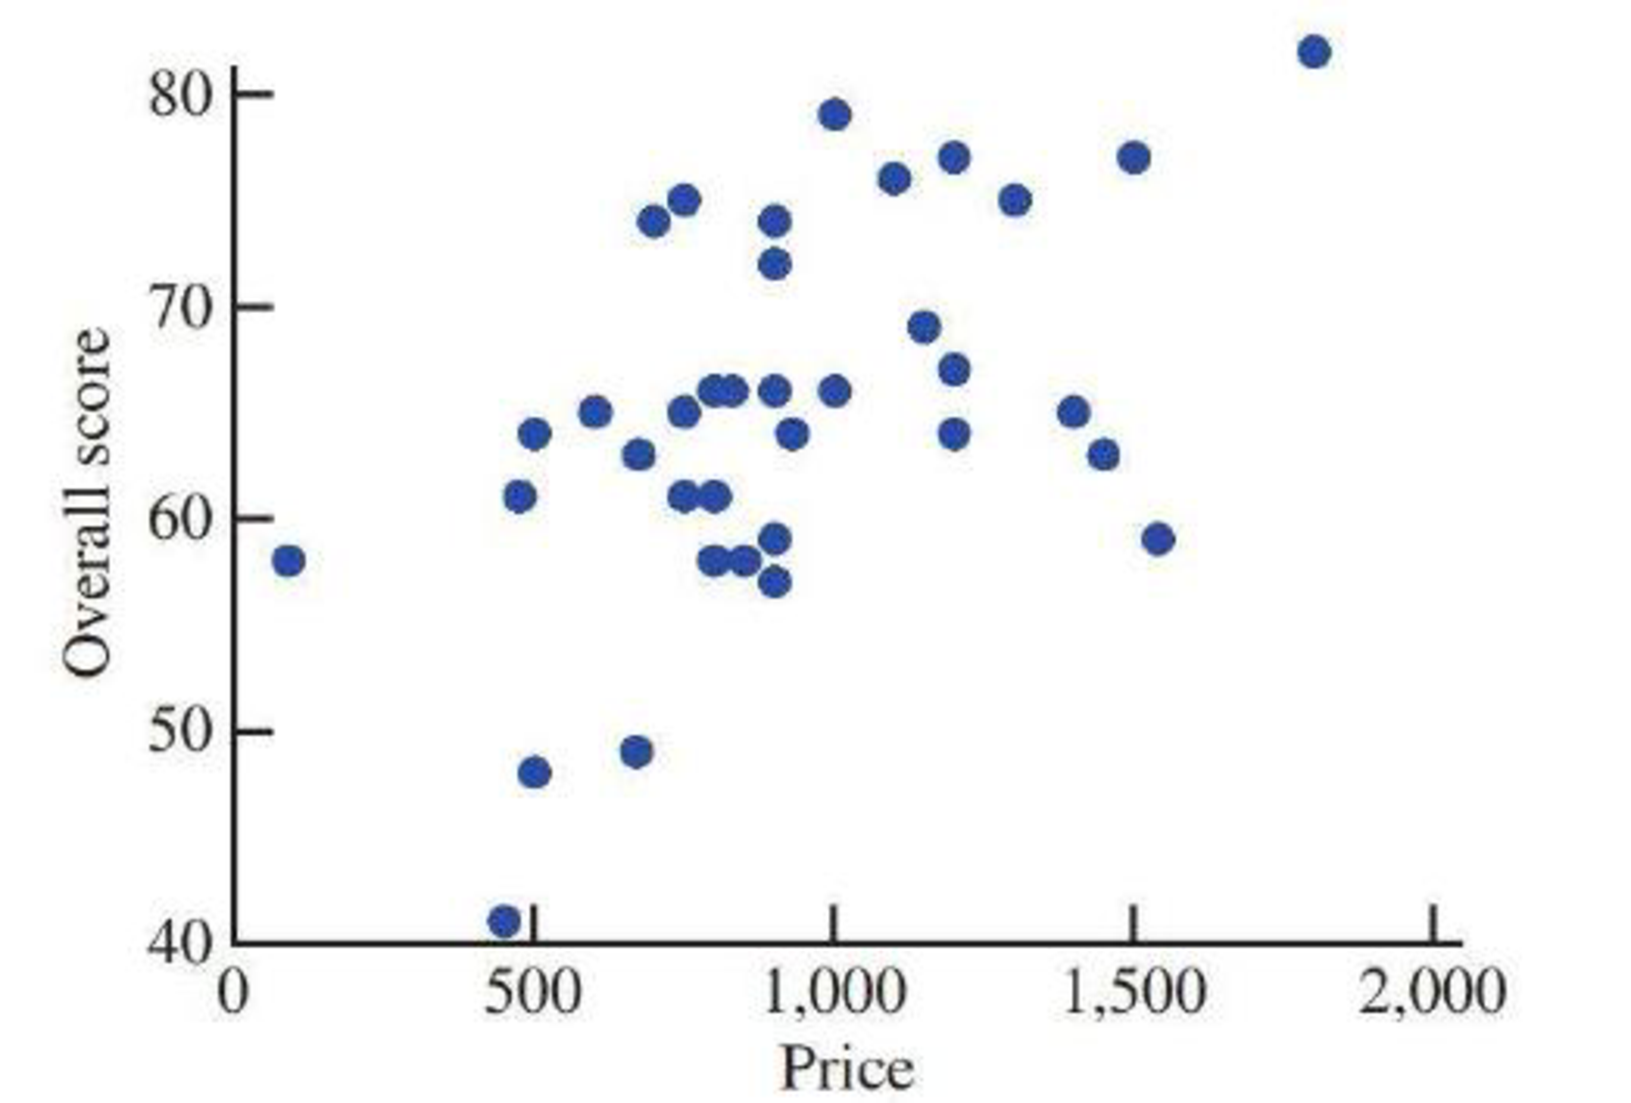
Would you describe the relationship between price and overall score for these laptops as positive (overall score tends to increase as price increases) or negative (overall score tends to decrease as price increases)? Explain.
Want to see the full answer?
Check out a sample textbook solution
Chapter 3 Solutions
Introduction To Statistics And Data Analysis
Additional Math Textbook Solutions
APPLIED STAT.IN BUS.+ECONOMICS
Finite Mathematics for Business, Economics, Life Sciences and Social Sciences
Calculus for Business, Economics, Life Sciences, and Social Sciences (14th Edition)
Thinking Mathematically (6th Edition)
Elementary Statistics: Picturing the World (7th Edition)
Probability And Statistical Inference (10th Edition)


- I need help with this problem and an explanation of the solution for the image described below. (Statistics: Engineering Probabilities)arrow_forwardI need help with this problem and an explanation of the solution for the image described below. (Statistics: Engineering Probabilities)arrow_forwardDATA TABLE VALUES Meal Price ($) 22.78 31.90 33.89 22.77 18.04 23.29 35.28 42.38 36.88 38.55 41.68 25.73 34.19 31.75 25.24 26.32 19.57 36.57 32.97 36.83 30.17 37.29 25.37 24.71 28.79 32.83 43.00 35.23 34.76 33.06 27.73 31.89 38.47 39.42 40.72 43.92 36.51 45.25 33.51 29.17 30.54 26.74 37.93arrow_forward
- I need help with this problem and an explanation of the solution for the image described below. (Statistics: Engineering Probabilities)arrow_forwardSales personnel for Skillings Distributors submit weekly reports listing the customer contacts made during the week. A sample of 65 weekly reports showed a sample mean of 19.5 customer contacts per week. The sample standard deviation was 5.2. Provide 90% and 95% confidence intervals for the population mean number of weekly customer contacts for the sales personnel. 90% Confidence interval, to 2 decimals: ( , ) 95% Confidence interval, to 2 decimals:arrow_forwardA simple random sample of 40 items resulted in a sample mean of 25. The population standard deviation is 5. a. What is the standard error of the mean (to 2 decimals)? b. At 95% confidence, what is the margin of error (to 2 decimals)?arrow_forward
- mean trough level of the population to be 3.7 micrograms/mL. The researcher conducts a study among 93 newly diagnosed arthritis patients and finds the mean trough to be 4.1 micrograms/mL with a standard deviation of 2.4 micrograms/mL. The researcher wants to test at the 5% level of significance if the trough is different than previously reported or not. Z statistics will be used. Complete Step 5 of hypothesis testing: Conclusion. State whether or not you would reject the null hypothesis and why. Also interpret what this means (i.e. is the mean trough different from 3.7 or noarrow_forward30% of all college students major in STEM (Science, Technology, Engineering, and Math). If 48 college students are randomly selected, find the probability thata. Exactly 12 of them major in STEM. b. At most 17 of them major in STEM. c. At least 12 of them major in STEM. d. Between 9 and 13 (including 9 and 13) of them major in STEM.arrow_forward7% of all Americans live in poverty. If 40 Americans are randomly selected, find the probability thata. Exactly 4 of them live in poverty. b. At most 1 of them live in poverty. c. At least 1 of them live in poverty. d. Between 2 and 9 (including 2 and 9) of them live in poverty.arrow_forward
- 48% of all violent felons in the prison system are repeat offenders. If 40 violent felons are randomly selected, find the probability that a. Exactly 18 of them are repeat offenders. b. At most 18 of them are repeat offenders. c. At least 18 of them are repeat offenders. d. Between 17 and 21 (including 17 and 21) of them are repeat offenders.arrow_forwardConsider an MA(6) model with θ1 = 0.5, θ2 = −25, θ3 = 0.125, θ4 = −0.0625, θ5 = 0.03125, and θ6 = −0.015625. Find a much simpler model that has nearly the same ψ-weights.arrow_forwardLet {Yt} be an AR(2) process of the special form Yt = φ2Yt − 2 + et. Use first principles to find the range of values of φ2 for which the process is stationary.arrow_forward
 Glencoe Algebra 1, Student Edition, 9780079039897...AlgebraISBN:9780079039897Author:CarterPublisher:McGraw Hill
 Big Ideas Math A Bridge To Success Algebra 1: Stu...AlgebraISBN:9781680331141Author:HOUGHTON MIFFLIN HARCOURTPublisher:Houghton Mifflin Harcourt
 Holt Mcdougal Larson Pre-algebra: Student Edition...AlgebraISBN:9780547587776Author:HOLT MCDOUGALPublisher:HOLT MCDOUGAL
 Functions and Change: A Modeling Approach to Coll...AlgebraISBN:9781337111348Author:Bruce Crauder, Benny Evans, Alan NoellPublisher:Cengage Learning