
Introduction To Statistics And Data Analysis
6th Edition
ISBN: 9781337793612
Author: PECK, Roxy.
Publisher: Cengage Learning,
expand_more
expand_more
format_list_bulleted
Videos
Textbook Question
Chapter 3, Problem 16CRE
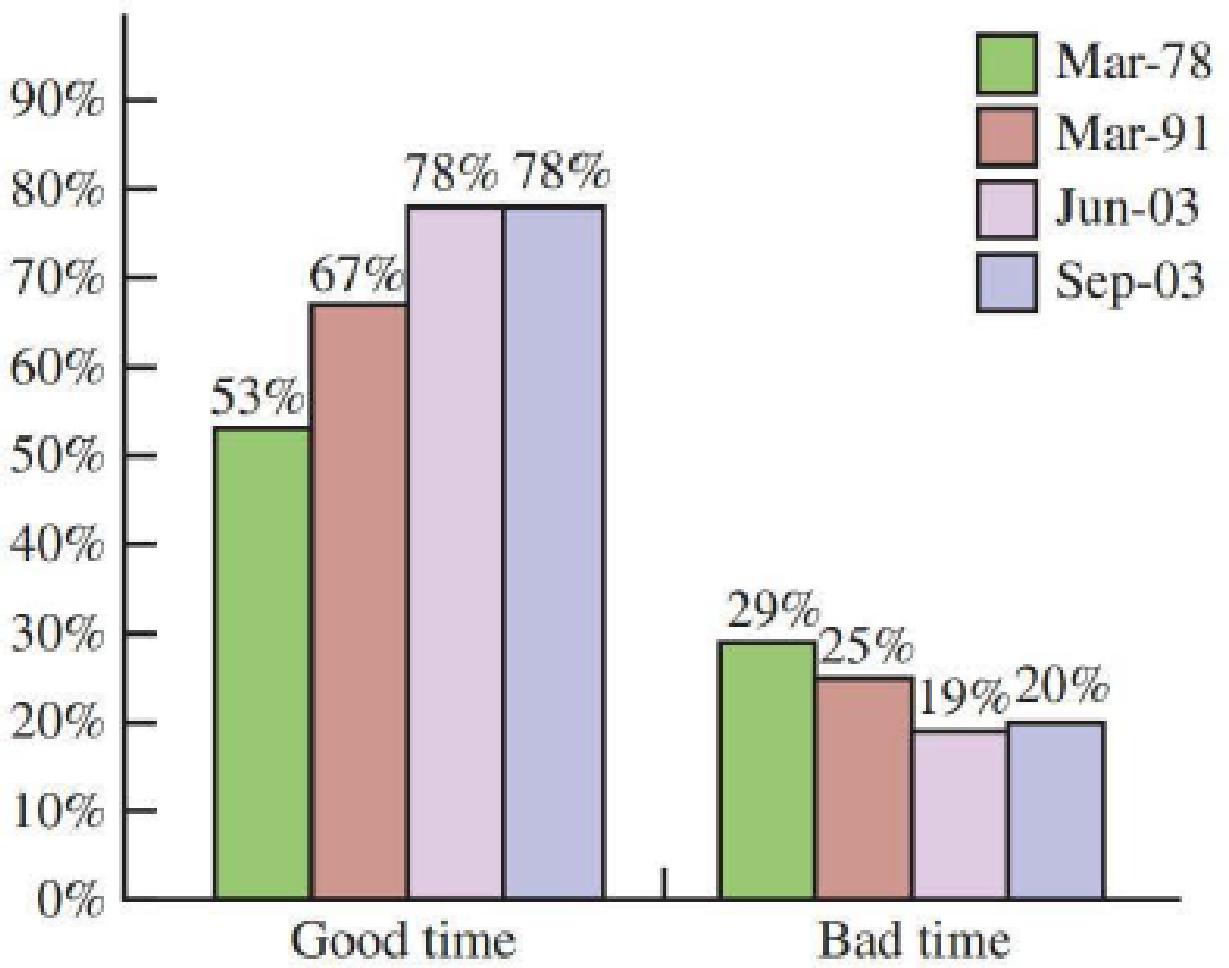
An article that appeared in USA TODAY (September 3, 2003) included a graph similar to the one shown here summarizing responses from polls conducted in 1978, 1991, and 2003 in which a sample of American adults were asked whether or not it was a good time or a bad time to buy a house.
- a. Construct a time series plot that shows how the percentage that thought it was a good time to buy a house has changed over time.
- b. Add a new line to the plot from Part (a) showing the percentage that thought it was a bad time to buy a house over time. Be sure to label the lines clearly.
- c. Which graph, the given bar chart or the time series plot, best shows the trend over time?
Expert Solution & Answer
Want to see the full answer?
Check out a sample textbook solution
Students have asked these similar questions
The following are suggested designs for group sequential studies. Using PROCSEQDESIGN, provide the following for the design O’Brien Fleming and Pocock.• The critical boundary values for each analysis of the data• The expected sample sizes at each interim analysisAssume the standardized Z score method for calculating boundaries.Investigators are evaluating the success rate of a novel drug for treating a certain type ofbacterial wound infection. Since no existing treatment exists, they have planned a one-armstudy. They wish to test whether the success rate of the drug is better than 50%, whichthey have defined as the null success rate. Preliminary testing has estimated the successrate of the drug at 55%. The investigators are eager to get the drug into production andwould like to plan for 9 interim analyses (10 analyzes in total) of the data. Assume thesignificance level is 5% and power is 90%.Besides, draw a combined boundary plot (OBF, POC, and HP)
Please provide the solution for the attached image in detailed.
20 km, because
GISS
Worksheet 10
Jesse runs a small business selling and delivering mealie meal to the spaza shops.
He charges a fixed rate of R80, 00 for delivery and then R15, 50 for each packet of
mealle meal he delivers. The table below helps him to calculate what to charge
his customers.
10
20
30
40
50
Packets of mealie
meal (m)
Total costs in Rands
80
235
390
545
700
855
(c)
10.1.
Define the following terms:
10.1.1. Independent Variables
10.1.2. Dependent Variables
10.2.
10.3.
10.4.
10.5.
Determine the independent and dependent variables.
Are the variables in this scenario discrete or continuous values? Explain
What shape do you expect the graph to be? Why?
Draw a graph on the graph provided to represent the information in the
table above.
TOTAL COST OF PACKETS OF MEALIE MEAL
900
800
700
600
COST (R)
500
400
300
200
100
0
10
20
30
40
60
NUMBER OF PACKETS OF MEALIE MEAL
Chapter 3 Solutions
Introduction To Statistics And Data Analysis
Ch. 3.1 - Each person in a nationally representative sample...Ch. 3.1 - The graphical display on the next page is similar...Ch. 3.1 - The survey referenced in the previous exercise was...Ch. 3.1 - The National Confectioners Association asked 1006...Ch. 3.1 - College student attitudes about e-books were...Ch. 3.1 - The Center for Science in the Public Interest...Ch. 3.1 - Using the data given in the previous exercise,...Ch. 3.1 - The article Housework around the World (USA TODAY,...Ch. 3.1 - The authors of the report Findings from the 2009...Ch. 3.1 - The survey on student attitude toward e-books...
Ch. 3.1 - During 2017, Gallup conducted a survey of adult...Ch. 3.1 - An article about college loans (New Rules Would...Ch. 3.1 - The report Findings From the 2014 College Senior...Ch. 3.2 - The National Center for Health Statistics provided...Ch. 3.2 - The paper State-Level Cancer Mortality...Ch. 3.2 - The accompanying data on seat belt use for each of...Ch. 3.2 - The previous exercise gave data on seat belt use...Ch. 3.2 - The U.S. Department of Health and Human Services...Ch. 3.2 - The article Economy Low, Generosity High (USA...Ch. 3.2 - The U.S. gasoline tax per gallon data for each of...Ch. 3.2 - A report from Texas Transportation Institute...Ch. 3.2 - The percentage of teens not in school or working...Ch. 3.3 - The data in the accompanying table are from the...Ch. 3.3 - The accompanying data on annual maximum wind speed...Ch. 3.3 - The accompanying relative frequency table is based...Ch. 3.3 - The data in the accompanying table represents the...Ch. 3.3 - Construct a histogram for the data in the previous...Ch. 3.3 - The following two relative frequency distributions...Ch. 3.3 - U.S. Census data for San Luis Obispo County,...Ch. 3.3 - Use the commute time data given in the previous...Ch. 3.3 - The report Trends in College Pricing 2012...Ch. 3.3 - An exam is given to students in an introductory...Ch. 3.3 - The accompanying frequency distribution summarizes...Ch. 3.3 - Example 3.19 used annual rainfall data for...Ch. 3.3 - Use the relative frequency distribution...Ch. 3.3 - Prob. 37ECh. 3.3 - Use the cumulative relative frequencies given in...Ch. 3.3 - Using the five class intervals 100 to 120, 120 to...Ch. 3.4 - The accompanying table gives data from a survey of...Ch. 3.4 - Consumer Reports Health (consumerreports.org) gave...Ch. 3.4 - Consumer Reports rated 29 fitness trackers (such...Ch. 3.4 - Consumer Reports (consumerreports.org) rated 37...Ch. 3.4 - The Solid Waste Management section of the...Ch. 3.4 - The report Daily Cigarette Use: Indicators on...Ch. 3.4 - The accompanying time series plot of movie box...Ch. 3.5 - The accompanying comparative bar chart is similar...Ch. 3.5 - The figure at the top left of the next page is...Ch. 3.5 - The figure at the top right of the next page is...Ch. 3.5 - The two graphical displays below are similar to...Ch. 3.5 - The following graphical display is similar to one...Ch. 3.5 - Explain why the following graphical display...Ch. 3 - Each year, The Princeton Review conducts surveys...Ch. 3 - Prob. 55CRCh. 3 - Prob. 56CRCh. 3 - Prob. 57CRCh. 3 - Prob. 58CRCh. 3 - Does the size of a transplanted organ matter? A...Ch. 3 - Prob. 60CRCh. 3 - The article Tobacco and Alcohol Use in G-Rated...Ch. 3 - Prob. 62CRCh. 3 - Prob. 63CRCh. 3 - Many nutritional experts have expressed concern...Ch. 3 - Americium 241 (241Am) is a radioactive material...Ch. 3 - Does eating broccoli reduce the risk of prostate...Ch. 3 - An article that appeared in USA TODAY (August 11,...Ch. 3 - Sometimes samples are composed entirely of...Ch. 3 - Prob. 4CRECh. 3 - More than half of Californias doctors say they are...Ch. 3 - Based on observing more than 400 drivers in the...Ch. 3 - An article from the Associated Press (May 14,...Ch. 3 - Prob. 8CRECh. 3 - Prob. 9CRECh. 3 - Prob. 10CRECh. 3 - The article Determination of Most Representative...Ch. 3 - The paper Lessons from Pacemaker Implantations...Ch. 3 - How does the speed of a runner vary over the...Ch. 3 - Prob. 14CRECh. 3 - One factor in the development of tennis elbow, a...Ch. 3 - An article that appeared in USA TODAY (September...
Additional Math Textbook Solutions
Find more solutions based on key concepts
Provide an example of a qualitative variable and an example of a quantitative variable.
Elementary Statistics ( 3rd International Edition ) Isbn:9781260092561
(a) Make a stem-and-leaf plot for these 24 observations on the number of customers who used a down-town CitiBan...
APPLIED STAT.IN BUS.+ECONOMICS
Find E(X) for each of the distributions given in Exercise 2.1-3.
Probability And Statistical Inference (10th Edition)
Find all solutions of each equation in the interval .
Precalculus: A Unit Circle Approach (3rd Edition)
The largest polynomial that divides evenly into a list of polynomials is called the _______.
Elementary & Intermediate Algebra
NOTE: Write your answers using interval notation when appropriate.
CHECKING ANALYTIC SKILLS Fill in each blank ...
Graphical Approach To College Algebra
Knowledge Booster


Learn more about
Need a deep-dive on the concept behind this application? Look no further. Learn more about this topic, statistics and related others by exploring similar questions and additional content below.Similar questions
- Let X be a random variable with support SX = {−3, 0.5, 3, −2.5, 3.5}. Part ofits probability mass function (PMF) is given bypX(−3) = 0.15, pX(−2.5) = 0.3, pX(3) = 0.2, pX(3.5) = 0.15.(a) Find pX(0.5).(b) Find the cumulative distribution function (CDF), FX(x), of X.1(c) Sketch the graph of FX(x).arrow_forwardA well-known company predominantly makes flat pack furniture for students. Variability with the automated machinery means the wood components are cut with a standard deviation in length of 0.45 mm. After they are cut the components are measured. If their length is more than 1.2 mm from the required length, the components are rejected. a) Calculate the percentage of components that get rejected. b) In a manufacturing run of 1000 units, how many are expected to be rejected? c) The company wishes to install more accurate equipment in order to reduce the rejection rate by one-half, using the same ±1.2mm rejection criterion. Calculate the maximum acceptable standard deviation of the new process.arrow_forward5. Let X and Y be independent random variables and let the superscripts denote symmetrization (recall Sect. 3.6). Show that (X + Y) X+ys.arrow_forward
- 8. Suppose that the moments of the random variable X are constant, that is, suppose that EX" =c for all n ≥ 1, for some constant c. Find the distribution of X.arrow_forward9. The concentration function of a random variable X is defined as Qx(h) = sup P(x ≤ X ≤x+h), h>0. Show that, if X and Y are independent random variables, then Qx+y (h) min{Qx(h). Qr (h)).arrow_forward10. Prove that, if (t)=1+0(12) as asf->> O is a characteristic function, then p = 1.arrow_forward
- 9. The concentration function of a random variable X is defined as Qx(h) sup P(x ≤x≤x+h), h>0. (b) Is it true that Qx(ah) =aQx (h)?arrow_forward3. Let X1, X2,..., X, be independent, Exp(1)-distributed random variables, and set V₁₁ = max Xk and W₁ = X₁+x+x+ Isk≤narrow_forward7. Consider the function (t)=(1+|t|)e, ER. (a) Prove that is a characteristic function. (b) Prove that the corresponding distribution is absolutely continuous. (c) Prove, departing from itself, that the distribution has finite mean and variance. (d) Prove, without computation, that the mean equals 0. (e) Compute the density.arrow_forward
- 1. Show, by using characteristic, or moment generating functions, that if fx(x) = ½ex, -∞0 < x < ∞, then XY₁ - Y2, where Y₁ and Y2 are independent, exponentially distributed random variables.arrow_forward1. Show, by using characteristic, or moment generating functions, that if 1 fx(x): x) = ½exarrow_forward1990) 02-02 50% mesob berceus +7 What's the probability of getting more than 1 head on 10 flips of a fair coin?arrow_forward
arrow_back_ios
SEE MORE QUESTIONS
arrow_forward_ios
Recommended textbooks for you
 Glencoe Algebra 1, Student Edition, 9780079039897...AlgebraISBN:9780079039897Author:CarterPublisher:McGraw Hill
 Big Ideas Math A Bridge To Success Algebra 1: Stu...AlgebraISBN:9781680331141Author:HOUGHTON MIFFLIN HARCOURTPublisher:Houghton Mifflin Harcourt
 Holt Mcdougal Larson Pre-algebra: Student Edition...AlgebraISBN:9780547587776Author:HOLT MCDOUGALPublisher:HOLT MCDOUGAL
 Trigonometry (MindTap Course List)TrigonometryISBN:9781305652224Author:Charles P. McKeague, Mark D. TurnerPublisher:Cengage Learning
Glencoe Algebra 1, Student Edition, 9780079039897...
Algebra
ISBN:9780079039897
Author:Carter
Publisher:McGraw Hill
Big Ideas Math A Bridge To Success Algebra 1: Stu...
Algebra
ISBN:9781680331141
Author:HOUGHTON MIFFLIN HARCOURT
Publisher:Houghton Mifflin Harcourt
Holt Mcdougal Larson Pre-algebra: Student Edition...
Algebra
ISBN:9780547587776
Author:HOLT MCDOUGAL
Publisher:HOLT MCDOUGAL
Trigonometry (MindTap Course List)
Trigonometry
ISBN:9781305652224
Author:Charles P. McKeague, Mark D. Turner
Publisher:Cengage Learning
Time Series Analysis Theory & Uni-variate Forecasting Techniques; Author: Analytics University;https://www.youtube.com/watch?v=_X5q9FYLGxM;License: Standard YouTube License, CC-BY
Operations management 101: Time-series, forecasting introduction; Author: Brandoz Foltz;https://www.youtube.com/watch?v=EaqZP36ool8;License: Standard YouTube License, CC-BY