a.
To create a graph
a.
Explanation of Solution
Given information:
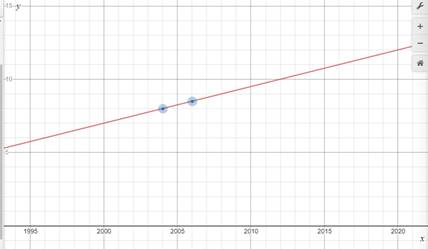
In 2004, 8 million American participated
In 2006, 8.5 million American participated.
Graph:

Interpretation:
The x -axis is year and y -axis is number of people in millions.
b.
To find the growth of sport.
b.
Answer to Problem 26PPS
The growth is
Explanation of Solution
Given information:
In 2004, 8 million American participated
In 2006, 8.5 million American participated.
Formulaused:
Where,
Calculation:
Slope of the line is the growth of sports. So, to find slope,
Coordinates are:
Substituting value,
Slope of line is,
Solving,
Slope is
Hence, growth of sports is
a.
To find the total participants in 2013
a.
Answer to Problem 26PPS
Total participants are 10.2 million approximately.
Explanation of Solution
Given information:
In 2004, 8 million American participated
In 2006, 8.5 million American participated.
Calculation:
Observing the graph, the number of participants can be found by looking at value of y -axis on 2013.
So, number of participants are 10.2 million approximately.
Chapter 3 Solutions
Geometry, Student Edition
Additional Math Textbook Solutions
Basic Business Statistics, Student Value Edition
University Calculus: Early Transcendentals (4th Edition)
Introductory Statistics
Elementary Statistics (13th Edition)
Elementary Statistics: Picturing the World (7th Edition)
- Can someone help me with this please?arrow_forwardMariela is in her classroom and looking out of a window at a tree, which is 20 feet away. Mariela’s line of sight to the top of the tree creates a 42° angle of elevation, and her line of sight to the base of the tree creates a 31° angle of depression. What is the height of the tree, rounded to the nearest foot? Be sure to show your work to explain how you got your answer.arrow_forward1arrow_forward
 Elementary Geometry For College Students, 7eGeometryISBN:9781337614085Author:Alexander, Daniel C.; Koeberlein, Geralyn M.Publisher:Cengage,
 Elementary Geometry for College StudentsGeometryISBN:9781285195698Author:Daniel C. Alexander, Geralyn M. KoeberleinPublisher:Cengage Learning

