Concept explainers
Videos
To graph: the polynomial function
Explanation of Solution
Given information: the function is
Graph:
The
For
Therefore if
Now multiply the leading terms of each factor of polynomials to get leading term of polynomial
Leading terms:
Now,
Create a table of value for several values of the variable
| | |
| −2 | −3 |
| 2 | 9 |
Finally draw a graph of polynomial function plot the point
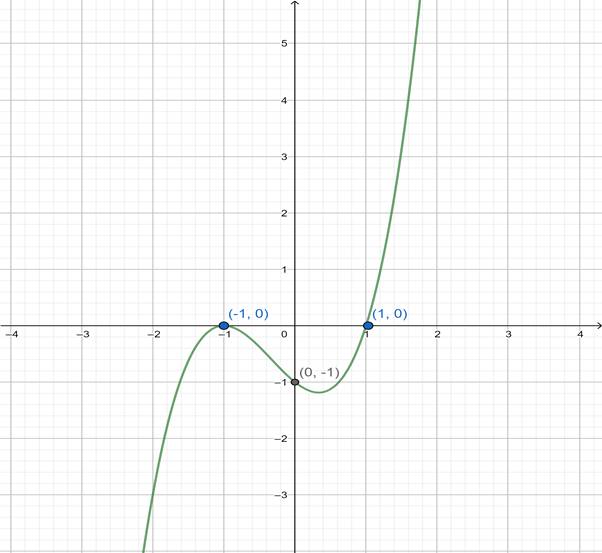
Interpretation:
From the above, it can be observed that the graph of
Chapter 3 Solutions
Precalculus: Mathematics for Calculus - 6th Edition


- Calculus lll May I please have the blank lines completed, and final statement defined as a result? Thank you for the support!arrow_forward3. Consider the polynomial equation 6-iz+7z² - iz³ +z = 0 for which the roots are 3i, -2i, -i, and i. (a) Verify the relations between this roots and the coefficients of the polynomial. (b) Find the annulus region in which the roots lie.arrow_forwardForce with 800 N and 400 N are acting on a machine part at 30° and 60°, respectively with the positive x axisarrow_forward
- Find the accumulated amount A, if the principal P is invested at an interest rate of r per year for t years. (Round your answer to the nearest cent.) P = $13,000, r = 6%, t = 10, compounded quarterly A = $ 31902 Need Help? Read It Watch It Viewing Saved Work Revert to Last Response SUBMIT ANSWER O/6.66 Points] DETAILS MY NOTES TANAPCALC10 5.3.003. EVIOUS ANSWERS ASK YOUR TEACHER PRACTICE ANOTHER Find the accumulated amount A, if the principal P is invested at an interest rate of r per year for t years. (Round your answer to the nearest cent.) P = $140,000, r = 8%, t = 8, compounded monthly A = $259130.20 X Need Help? Read It Watch Itarrow_forwardFind the present value of $20,000 due in 3 years at the given rate of interest. (Round your answers to the nearest cent.) (a) 2%/year compounded monthly (b) 5%/year compounded daily $ Need Help? Read It Watch It SUBMIT ANSWER [-/6.66 Points] DETAILS MY NOTES TANAPCALC10 5.3.009. ASK YOUR TEACHER PRACTICE ANC Find the accumulated amount after 3 years if $4000 is invested at 3%/year compounded continuously. (Round your answer to the nearest cent.) Need Help? Read It Watch Itarrow_forwardFind the effective rate corresponding to the given nominal rate. (Round your answers to three decimal places.) (a) 9.5%/year compounded monthly % (b) 9.5%/year compounded daily % Need Help? Read It Watch It SUBMIT ANSWER -/6.66 Points] DETAILS MY NOTES TANAPCALC10 5.3.007. ASK YOUR TEACHE Find the present value of $90,000 due in 7 years at the given rate of interest. (Round your answers to the nearest cent.) (a) 9%/year compounded semiannually (b) 9%/year compounded quarterly LAarrow_forward
- Find the accumulated amount A, if the principal P is invested at an interest rate of r per year for t years. (Round your answer to the nearest cent.) P = $160,000, r = 7%, t = 4, compounded daily A = $211113.60 Need Help? Read It SUBMIT ANSWER ASK YOUR TEACHER PRACTICE ANOTHER --/6.66 Points] DETAILS MY NOTES TANAPCALC10 5.3.005. Find the effective rate corresponding to the given nominal rate. (Round your answers to three decimal places.) (a) 8%/year compounded semiannually % (b) 9%/year compounded quarterly %arrow_forwardFind the derivative of the function. g'(t) = 9t g(t) = In(t) (9ln(t) - 1) [In(t)] 2 × Need Help? Read It Watch Itarrow_forwardFind the accumulated amount A, if the principal P is invested at an interest rate of r per year for t years. (Round your answer to the nearest cent.) P = $3800, r = 4%, t = 10, compounded semiannually A = $ 5645.60 × Need Help? Read It SUBMIT ANSWER [3.33/6.66 Points] DETAILS MY NOTES REVIOUS ANSWERS ASK YOUR TEACHER TANAPCALC10 5.3.001.EP. PRACTICE ANOTHER Consider the following where the principal P is invested at an interest rate of r per year for t years. P = $3,100, r = 4%, t = 10, compounded semiannually Determine m, the number of conversion periods per year. 2 Find the accumulated amount A (in dollars). (Round your answer to the nearest cent.) A = $ 4604.44arrow_forward
- Force with 800 N and 400 N are acting on a machine part at 30° and 60°, respectively with a positive x axis, Draw the diagram representing this situationarrow_forwardI forgot to mention to you to solve question 1 and 2. Can you solve it using all data that given in the pict i given and can you teach me about that.arrow_forwardexam review please help!arrow_forward
 Calculus: Early TranscendentalsCalculusISBN:9781285741550Author:James StewartPublisher:Cengage Learning
 Thomas' Calculus (14th Edition)CalculusISBN:9780134438986Author:Joel R. Hass, Christopher E. Heil, Maurice D. WeirPublisher:PEARSON
 Calculus: Early Transcendentals (3rd Edition)CalculusISBN:9780134763644Author:William L. Briggs, Lyle Cochran, Bernard Gillett, Eric SchulzPublisher:PEARSON
 Calculus: Early TranscendentalsCalculusISBN:9781319050740Author:Jon Rogawski, Colin Adams, Robert FranzosaPublisher:W. H. Freeman
 Calculus: Early Transcendental FunctionsCalculusISBN:9781337552516Author:Ron Larson, Bruce H. EdwardsPublisher:Cengage Learning